

Highlands Ranch vs. Sterling Ranch, CO: Homes, Taxes & Lifestyle — Homes for Sale & Market Scorecard
🏠 Featured Active Homes — Highlands Ranch vs. Sterling Ranch, CO: Homes, Taxes & Lifestyle
Showing top 12 of 254 active properties · 👉 Swipe left/right on mobile to browse homesNo featured homes in this view meet that minimum Above-Ground Sq Ft threshold today.
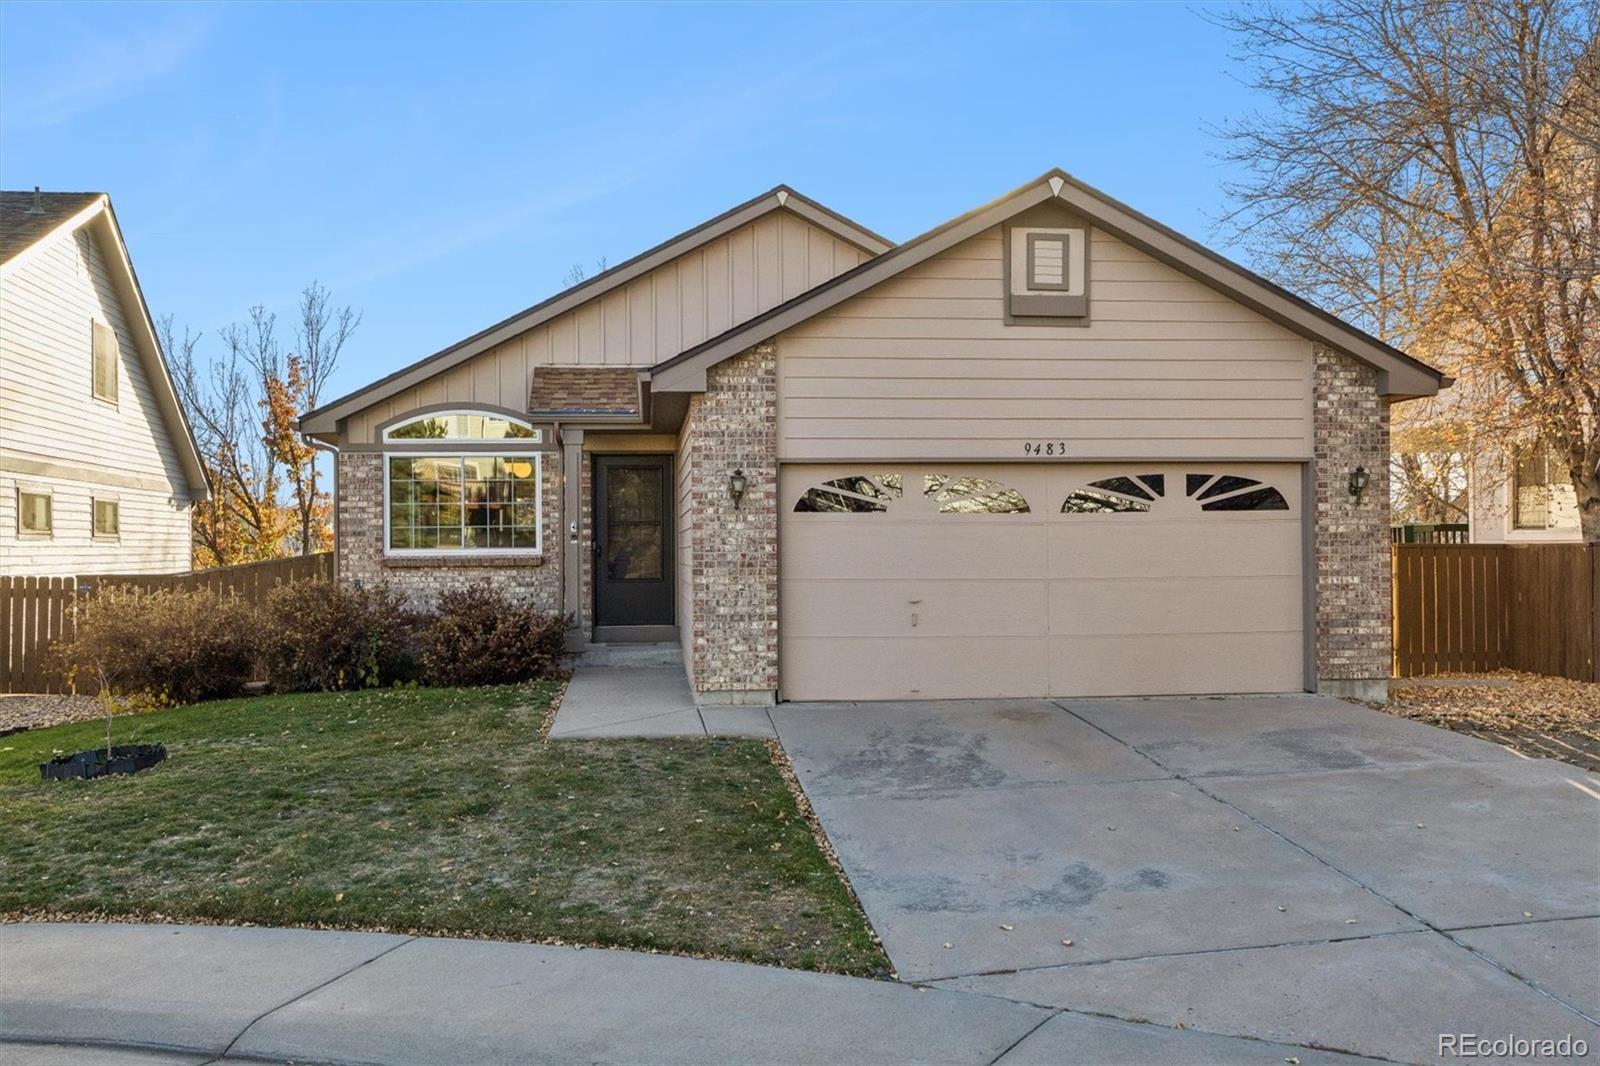

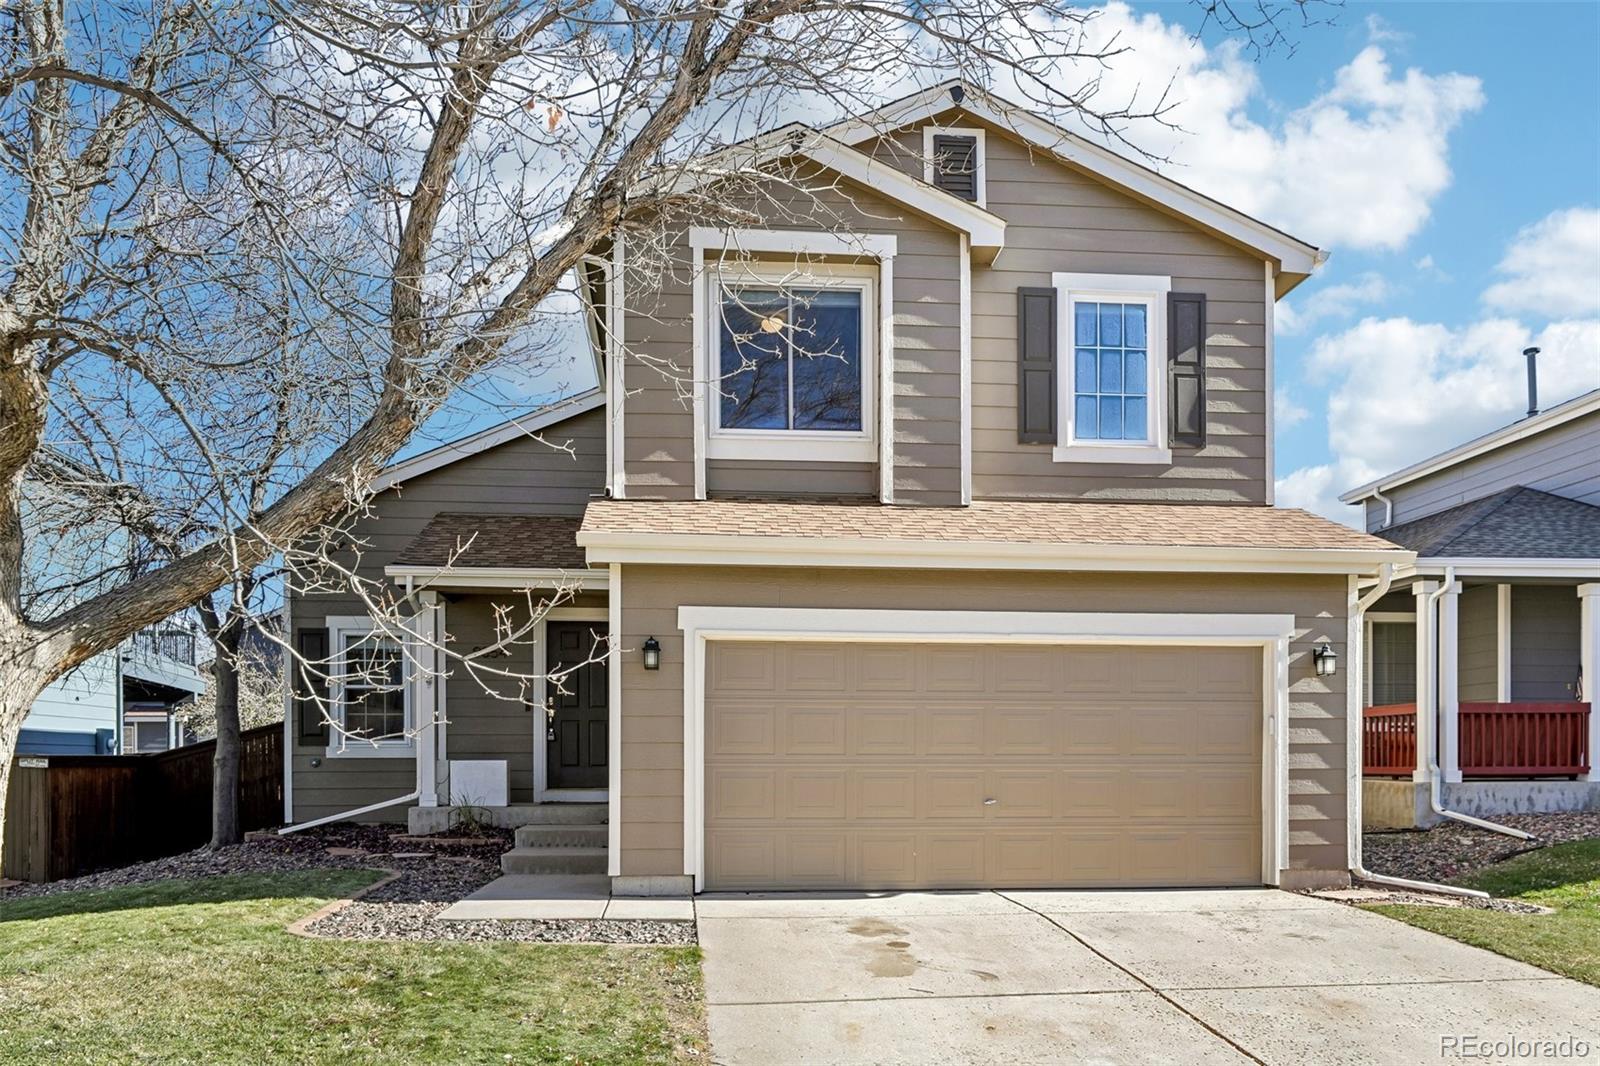
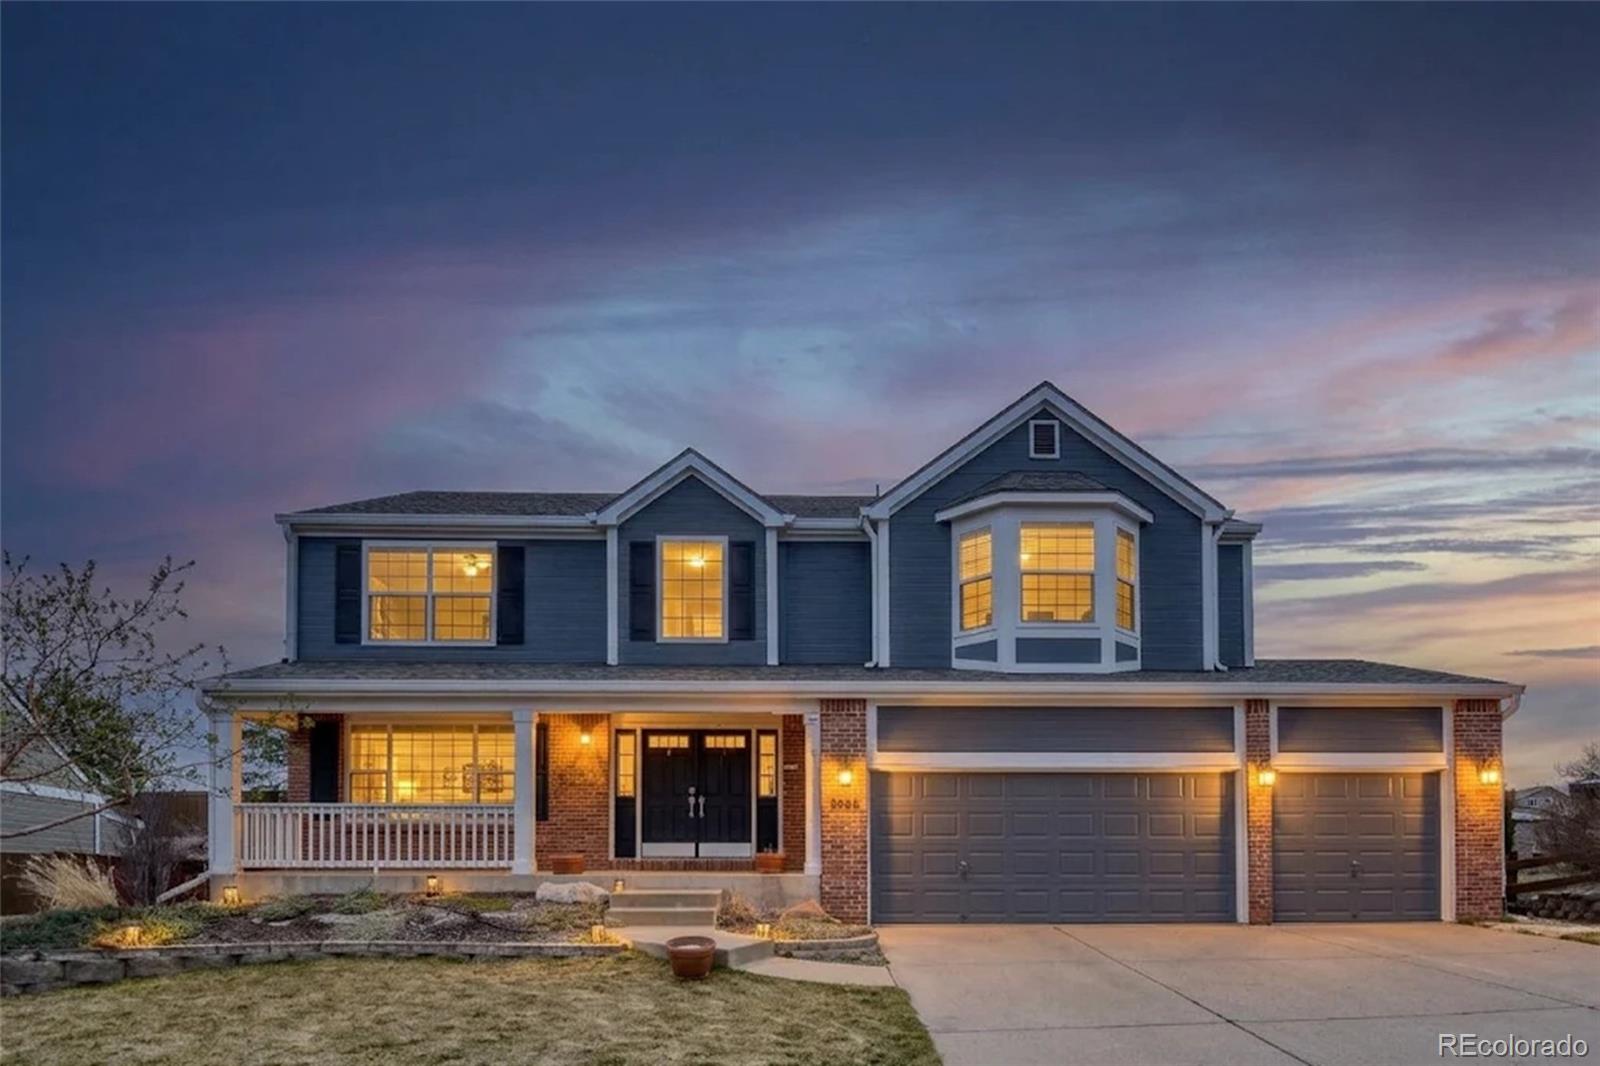
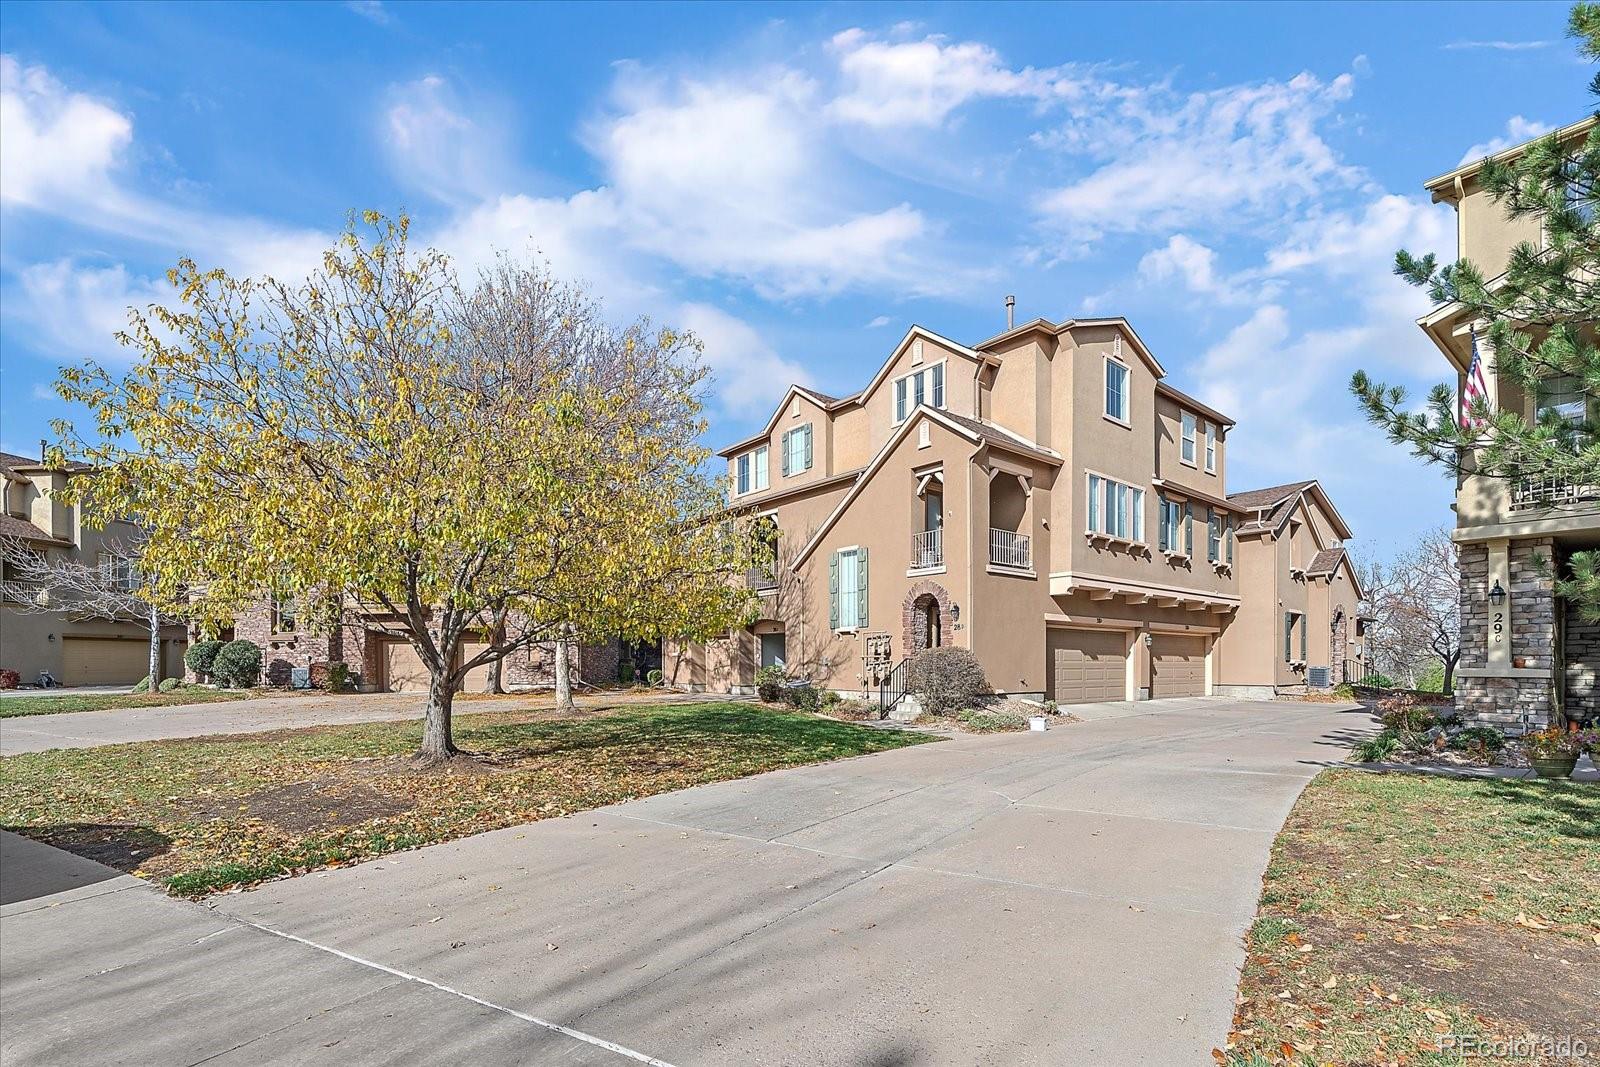
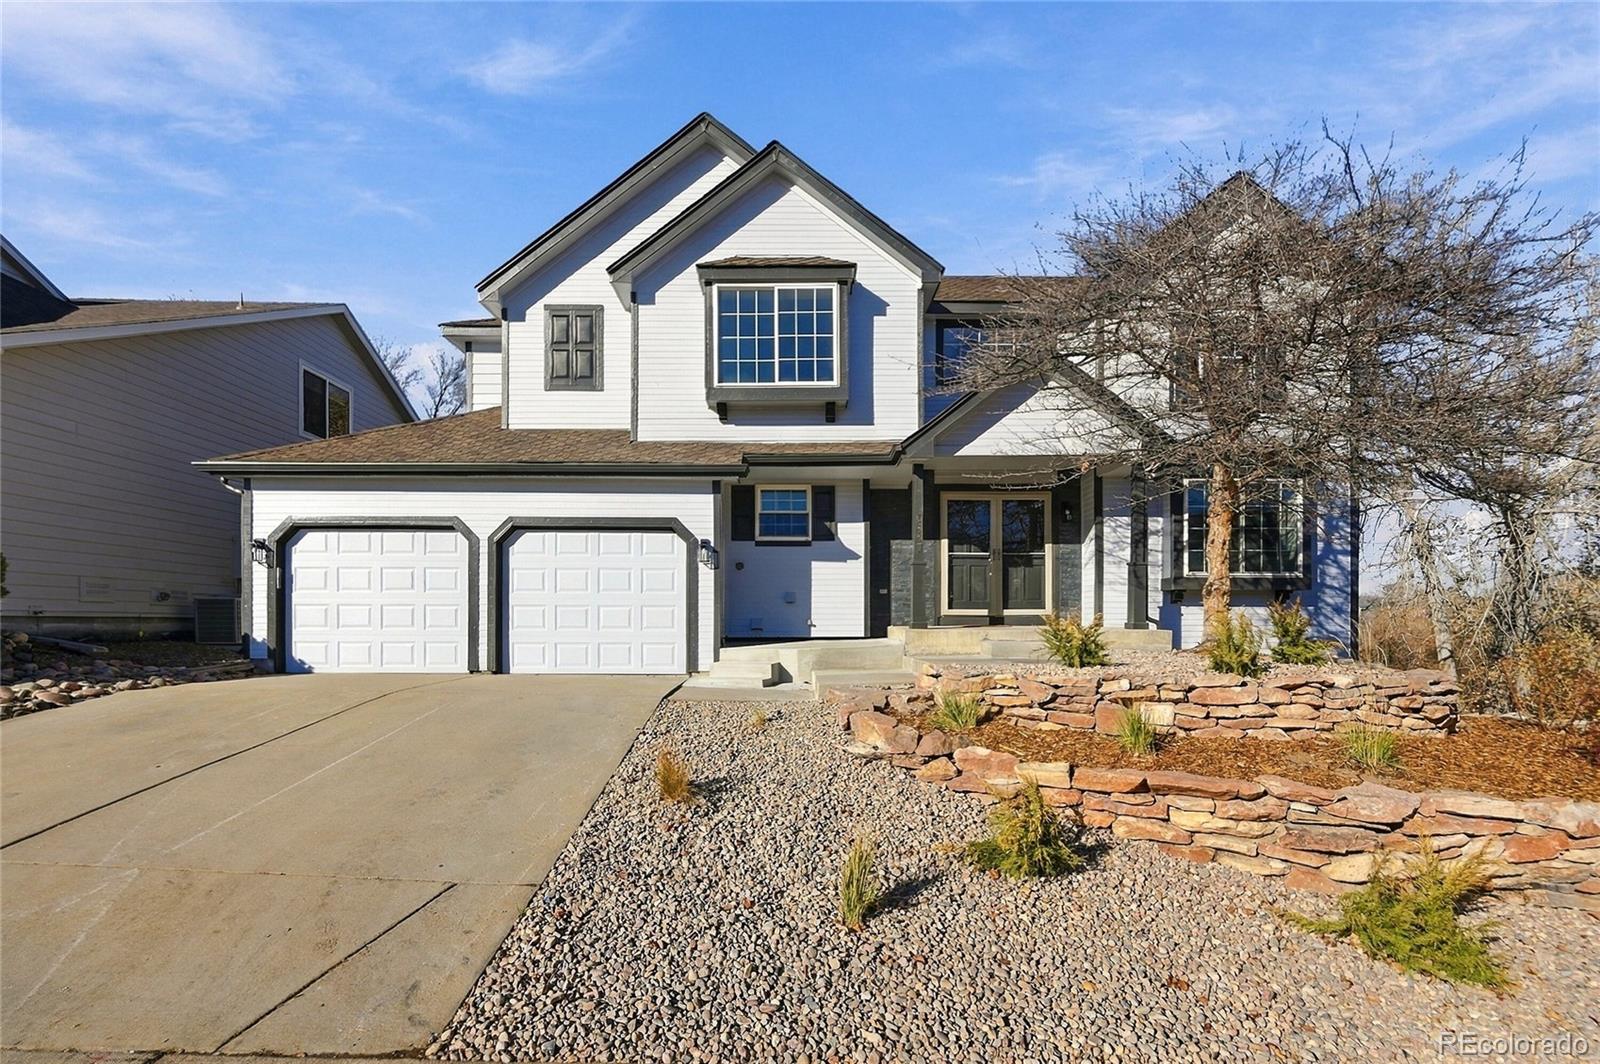

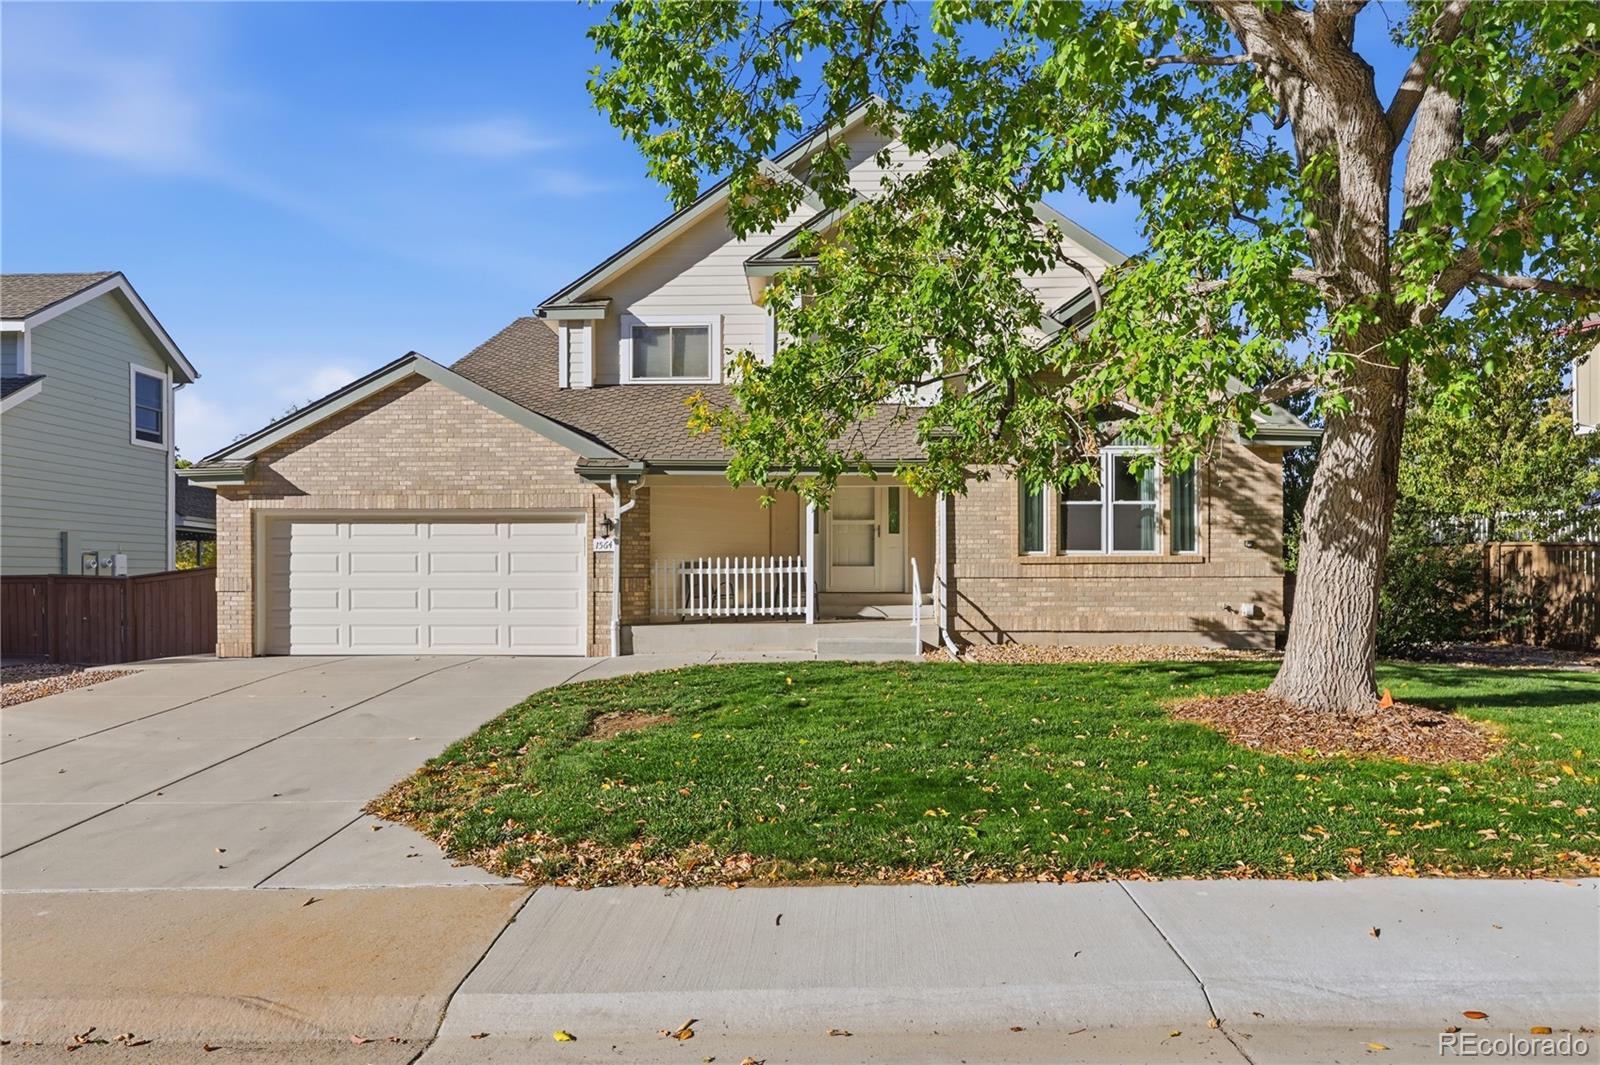
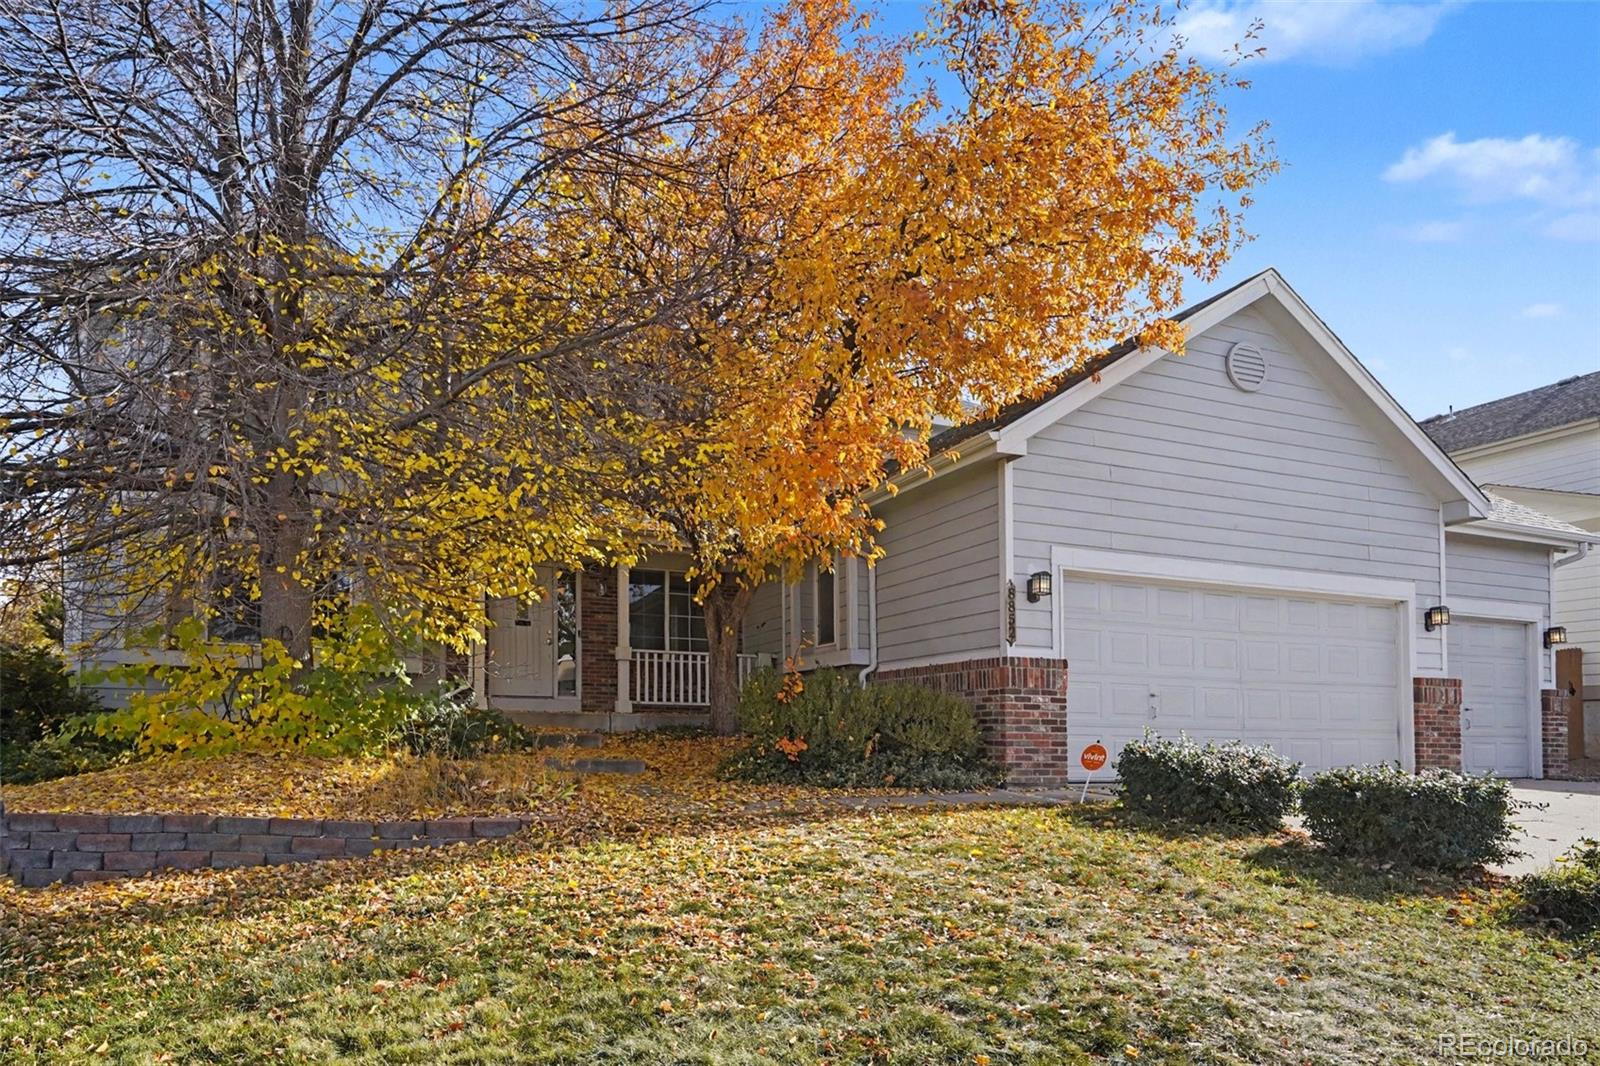
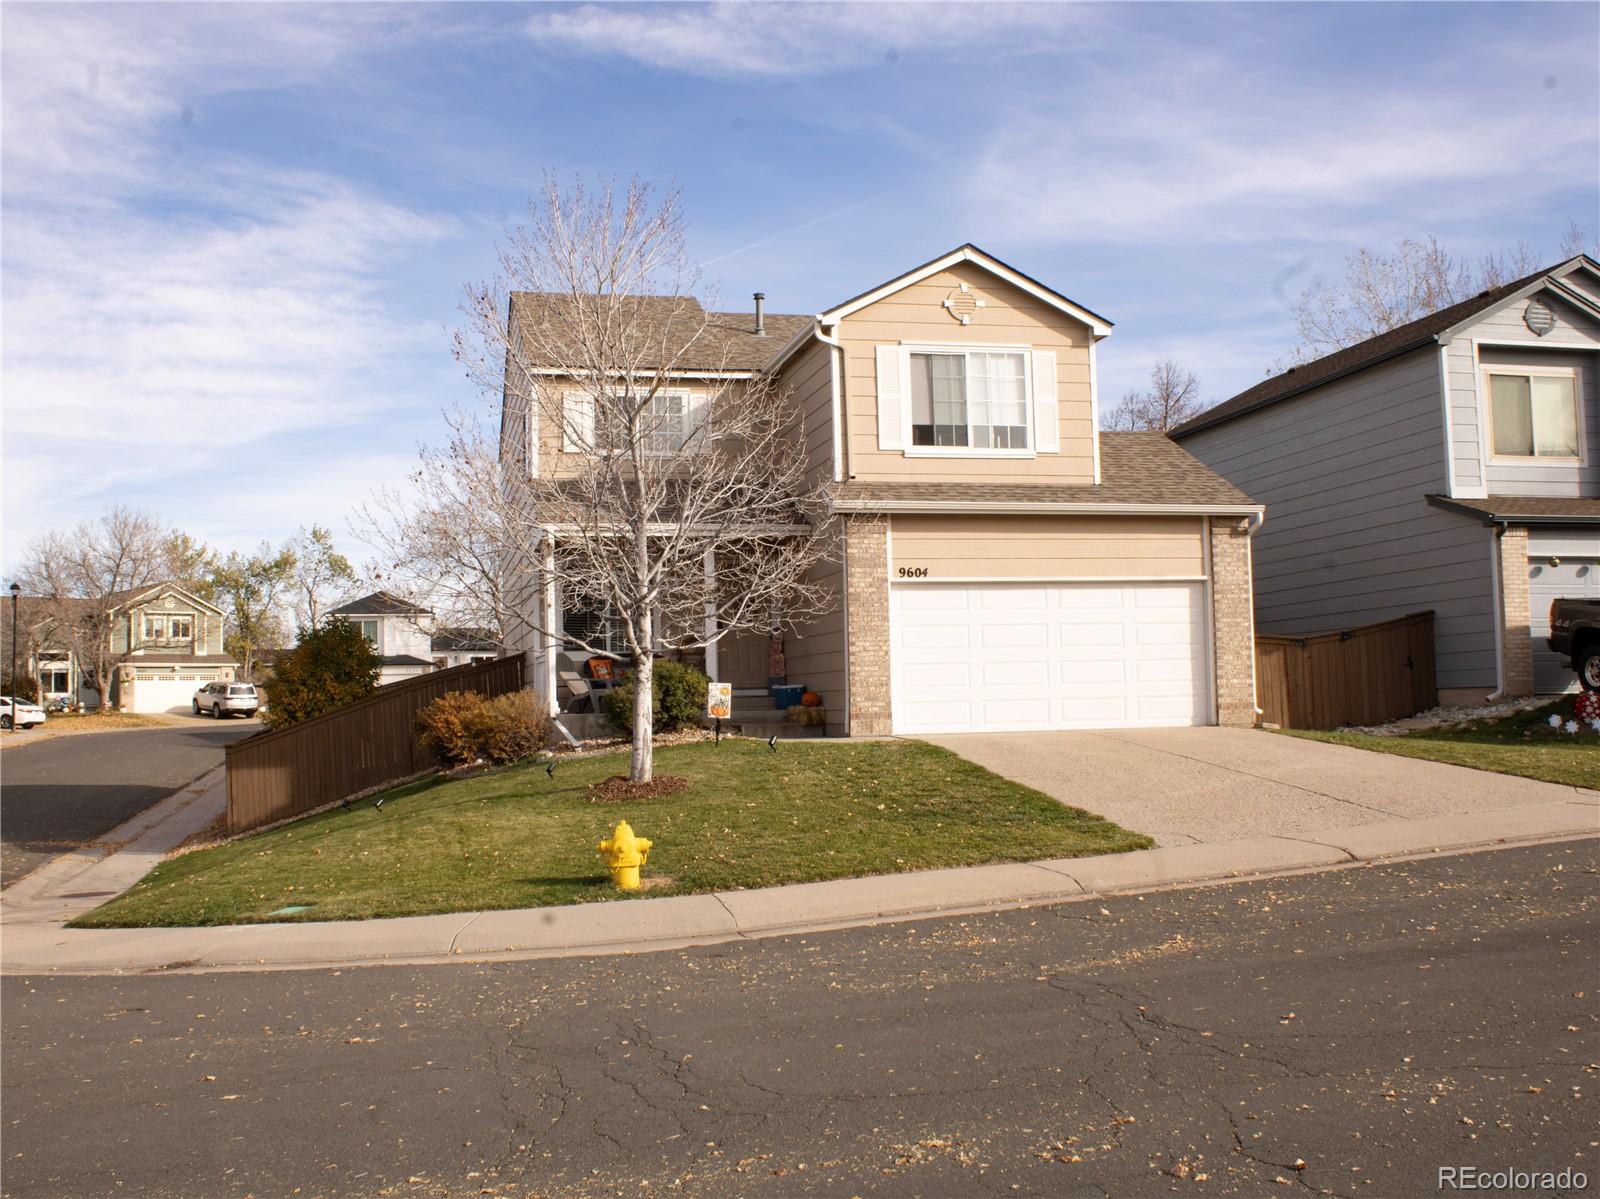
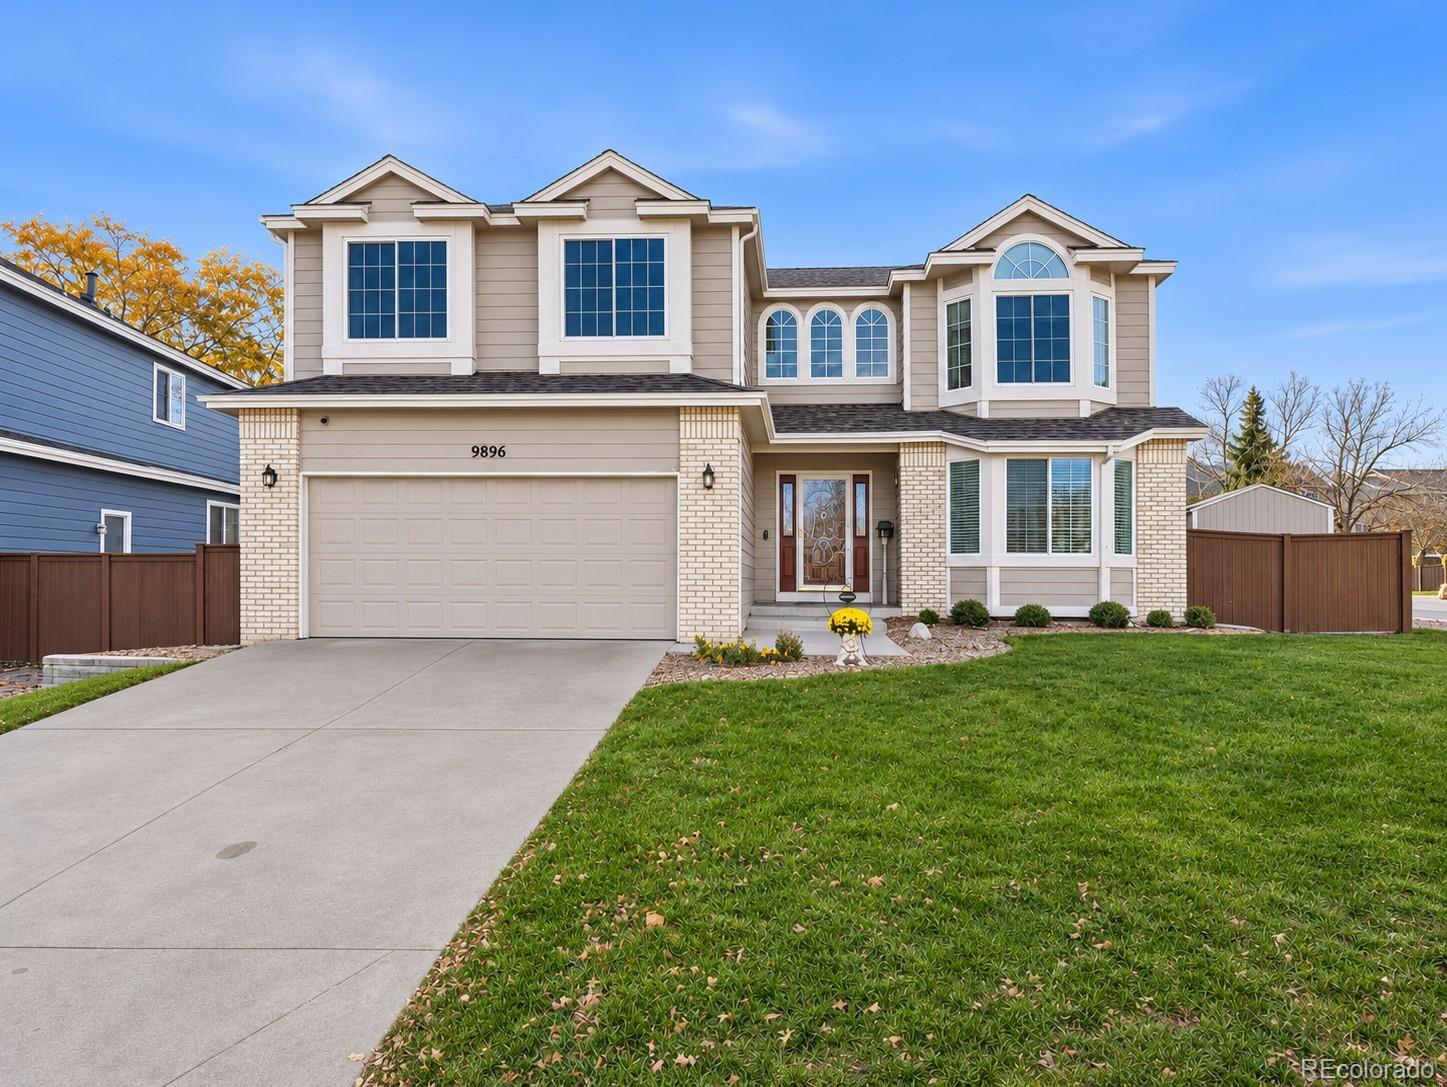
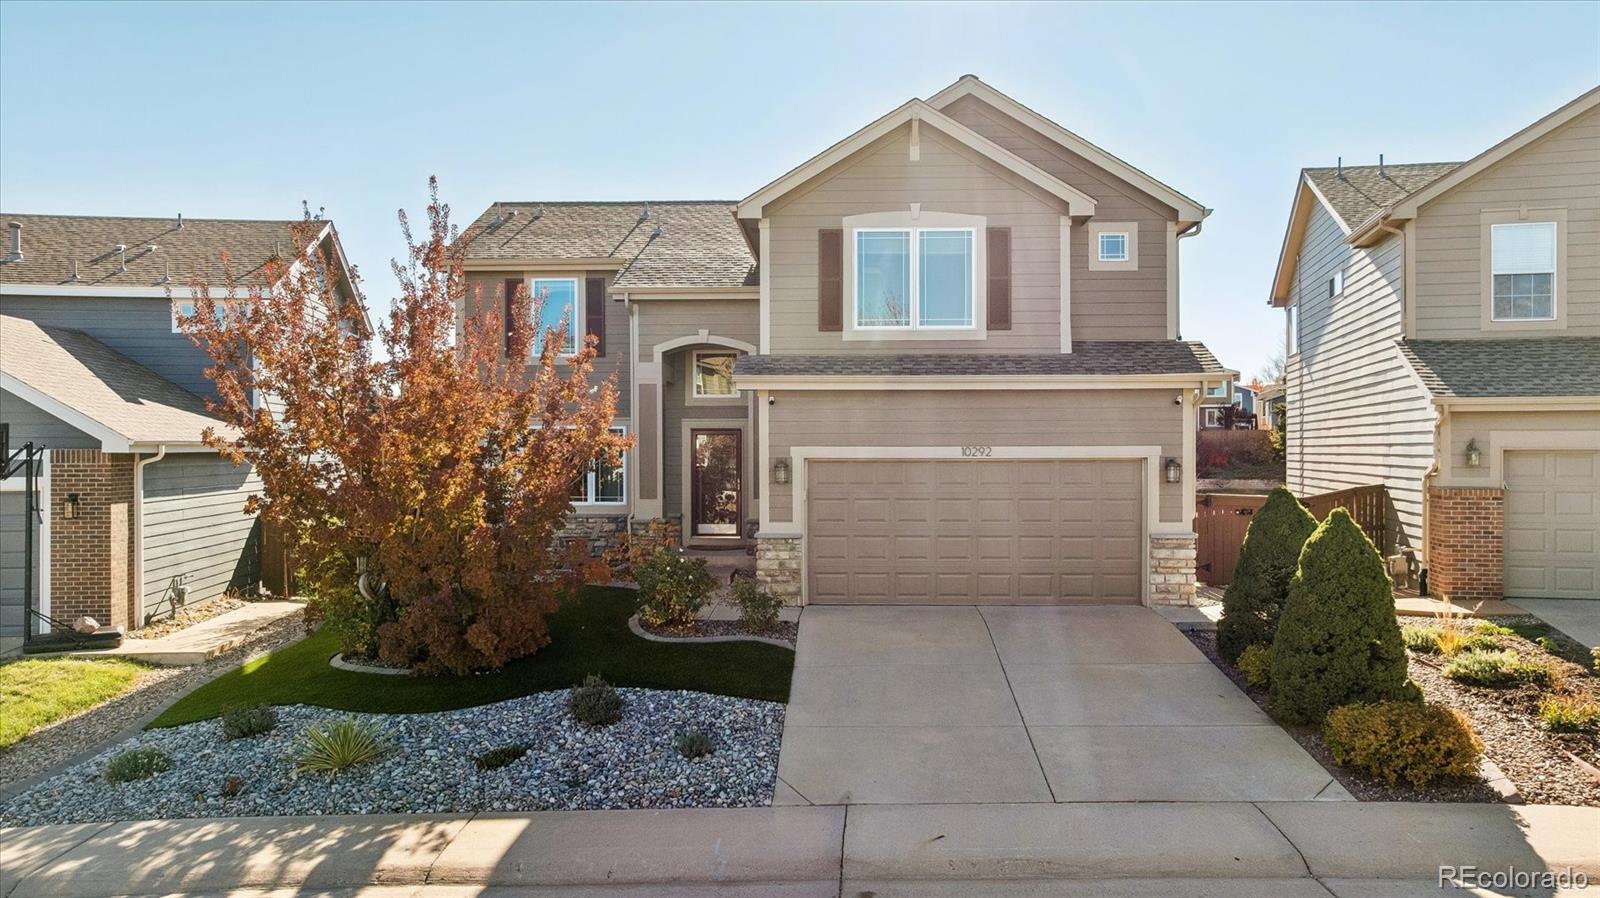
🏡 Single-Family Detached Homes
| Live & Last 90 Days Market Metric | Latest Market Data |
|---|---|
| Live Active & Under-Contract Supply | 182 Active · 64 Under Contract |
| Median & Avg Active List Price | Median: $700,000 · Avg: $781,113 |
| Active List Range & $/Total SqFt | $489,000 – $1,995,000 · $285/SqFt |
| % of Active Homes with a Price Reduction | 65% |
| Closed Sales (Last 12 Months) | 750 Sold · Median: $750,000 |
| All Highlands Ranch Benchmark (Last 90 Days) | 248 Sold · Med $715,000 · 27 Days on Market |
| All Highlands Ranch Seller Concessions (Last 90 Days) | 64.9% of sales · Avg $11,228 |
🏘️ Condos, Townhomes & Patio Homes
| Live & Last 90 Days Market Metric | Latest Market Data |
|---|---|
| Live Active & Under-Contract Supply | 72 Active · 11 Under Contract |
| Median & Avg Active List Price | Median: $459,900 · Avg: $477,646 |
| Active List Range & $/Total SqFt | $239,999 – $1,100,000 · $323/SqFt |
| % of Active Homes with a Price Reduction | 67% |
| Closed Sales (Last 12 Months) | 224 Sold · Median: $495,000 |
| All Highlands Ranch Benchmark (Last 90 Days) | 50 Sold · Med $482,500 · 58 Days on Market |
| All Highlands Ranch Seller Concessions (Last 90 Days) | 50% of sales · Avg $6,437 |
- Live Active Valuation Benchmark (Highlands Ranch vs. Sterling Ranch, CO: Homes, Taxes & Lifestyle): Currently tracking 182 active Single-Family Detached Homes (64 under contract · Median List: $700,000 · $285/SqFt) and 72 active Condos & Townhomes (11 under contract · Median List: $459,900 · $323/SqFt).
- For Sellers (Protecting Your Equity): Homes priced and prepared properly in Week 1 sell near 99%–100% of asking in 6–14 days with minimal concessions, avoiding the $36,000–$87,000+ price-cut trap.
- For Buyers (Negotiating Dollars Off): Once a listing crosses 21 days on market, 52%–67% of sellers pay $9,389–$17,676 in closing-cost and rate-buydown credits—giving us hard mathematical leverage when writing your offer. (Current Mortgage Interest Rates: 30-Yr Fixed 7.28% · 15-Yr Fixed 6.66%.)
Data Source: The latest market data and the most accurate market data (active listings updated daily; our sold data is updated every 30 days). Questions about negotiation leverage or remodeling ideas (basements, decks, landscaping, kitchens)? Call/text Saber Amine (Owner & Designated Broker, Homes and People) at 720-842-1600 or Contact Saber.
Highlands Ranch vs. Sterling Ranch & Solstice, CO (80125) — Live Active, Last 90 Days Sold & Buyer Negotiation Showdown
- Highlands Ranch Live Supply: 182 active Single-Family Homes (64 under contract · Median List: $700,000 · $285/SqFt) and 72 active Condos/Townhomes (11 under contract · Median List: $459,900).
- Sterling Ranch & Solstice, CO (80125) Live Supply: 152 active Single-Family Homes (35 under contract · Median List: $850,000 · $340/SqFt) and 23 active Condos/Townhomes (3 under contract · Median List: $521,795). Current Mortgage Interest Rates: 30-Yr Fixed 7.28% · 15-Yr Fixed 6.66%.
| Live & Closed Market Metric (Separated by Property Type) | Highlands Ranch, CO | Sterling Ranch & Solstice, CO (80125) |
|---|---|---|
| 🏡 Single-Family Active (Under Contract) | 182 Active (64 Under Contract) | 152 Active (35 Under Contract) |
| 🏡 Single-Family Median & Avg List Price | Median: $700,000 · Avg: $781,113 ($285/SqFt) | Median: $850,000 · Avg: $1,240,667 ($340/SqFt) |
| 🏡 Single-Family Price Range & % of Active Homes with a Price Reduction | $489,000 – $1,995,000 (65% of Active Homes Reduced Price) | $180,000 – $8,400,000 (53% of Active Homes Reduced Price) |
| 📊 Home Sale Success Rate (Last 90 Days) | 72.7% Sold (248 Homes) (27.3% Unsold — mostly overpriced Day-1 listings) | 66.2% Sold (104 Homes) (33.8% Unsold — mostly overpriced Day-1 listings) |
| 🏡 Single-Family Median / Average Sold Price (Last 90 Days) | $715,000 Median / $827,667 Avg · 12-Mo Median: $739,800 | $750,000 Median / $875,012 Avg · 12-Mo Median: $746,000 |
| 📐 Colorado 3-Benchmark Sold $/SqFt (Last 90 Days) | $349/SqFt Above-Grade · $286/SqFt Finished · $244/SqFt Total Footprint | $350/SqFt Above-Grade · $282/SqFt Finished · $226/SqFt Total Footprint |
| 🤝 Seller Concessions & Net-to-Seller (Last 90 Days) | 64.9% Paid Concessions (Avg $11,228 Credit · Median Net $713,250) | 49% Paid Concessions (Avg $15,307 Credit · Median Net $750,000) |
| ⏱️ Days on Market & Close-to-Original List (Last 90 Days) | 27 Days Median (51.1 Avg) · 96.19% Close-to-Original List | 42 Days Median (59.8 Avg) · 95.31% Close-to-Original List |
| 📅 12-Month Home Sale Success Rate & Cash Share (Last 365 Days) | 85.2% Sold (1097 Homes) (14.8% Unsold) · 17.4% Cash Buyers | 65.6% Sold (107 Homes) (34.4% Unsold) · 21.5% Cash Buyers |
| 🏘️ Condos & Townhomes Active (Under Contract) | 72 Active (11 Under Contract) | 23 Active (3 Under Contract) |
| 🏘️ Condos & Townhomes Median List, Avg & $/SqFt | Median: $459,900 · Avg: $477,646 ($323/SqFt) | Median: $521,795 · Avg: $518,702 ($308/SqFt) |
| 1-Click Live Interactive Map Search | Browse Active Homes in Highlands Ranch → | Browse Active Homes in Sterling Ranch & Solstice, CO (80125) → |
- Closed Sales Summary (Last 90 Days): Highlands Ranch leads Douglas County with a 72.7% Home Sale Success Rate (85.2% over 12 months), compared to 66.2% Sold (33.8% Unsold) in Sterling Ranch & Solstice, CO (80125).
- Price & $/SqFt Comparison: Single-Family Homes in Sterling Ranch & Solstice, CO (80125) closed at a $750,000 median (+$35,000 higher than Highlands Ranch) and $350/SqFt Above-Grade (+$1/SqFt Above-Grade premium vs. Highlands Ranch at $349/SqFt).
- For Sellers (Protecting Your Equity): Homes priced and prepared properly in Week 1 sell near 99%–100% of asking in 6–14 days with minimal concessions, avoiding the $36,000–$87,000+ price-cut trap.
- For Buyers (Negotiating Dollars Off): Once a listing crosses 21 days on market, 49% of Sterling Ranch & Solstice, CO (80125) sellers pay concessions averaging $15,307 (vs. 64.9% in Highlands Ranch averaging $11,228)—giving us hard mathematical leverage when writing your offer.
Data Source: The latest market data and the most accurate market data across South Metro Denver. Active inventory updates daily; our sold data is updated every 30 days.
How Do Home Prices & Resale Speed Compare Between Highlands Ranch and Sterling Ranch?
Sitting seven miles apart on Santa Fe Drive, built-out Highlands Ranch offers mature trees and three housing eras up to gated Backcountry, while Sterling Ranch offers new homes near Chatfield. Detached medians closed near ~$715,000 in Highlands Ranch (~3 in 4 sold in ~4 weeks) versus ~$750,000 in 80125, where resales sit two weeks longer beside new-home builder rate buydowns.
| Ownership Metric | Highlands Ranch (Core HRCA) | Sterling Ranch & 80125 Corridor |
|---|---|---|
| Detached Closed Median & Pace | ~$715,000 median (~3 in 4 sold in ~27 days; ~$1.22M in 2015+ luxury). | ~$750,000 median (~2 in 3 sold in ~42 days beside builder specs). |
| Finished Space & Seller Credits | ~$286/Finished SqFt (~2 in 3 sellers paid ~$11,200 avg credits). | ~$282/Finished SqFt (~1 in 2 paid ~$15,300 avg credits; unfinished basements common). |
| Attached Townhome / Condo Median | ~$483,000 median across low-maintenance patio & townhome pockets. | ~$523,000 median (~$490,000 net after builder closing incentives). |
| Property & Local Rail Taxes | ~$4,600/yr (~0.64%); most unincorporated homes outside 0.333% rail sales tax. | ~$8,500–$12,100/yr (~1.02%–1.26% CAB mills) + inside 0.333% 7A sales tax. |
| Recreation & Rail Transit | $174/qtr HRCA dues (4 rec centers); active Mineral D Line + ~2032 CoCo hub. | CAB stewardship + Overlook Clubhouse; planned ~2032 US-85 / Titan CoCo stop. |
+ More Data (See exact 90-day closed counts, 3-benchmark $/SqFt & tax district details)
- 90-Day Cohorts (Aug 5 – Nov 2, 2026): Core Highlands Ranch detached: 248/341 sold (72.7%, $715,000 med, $827,667 avg, 27d, 64.9% credits avg $11,228; 2015+ luxury: 20/25 at $1,224,975); attached: 50/94 ($482,500 med). Standalone Province Center isolated: 6/6 sold ($668,091 med). Sterling Ranch & 80125 detached: 104/157 sold (66.2%, $750,000 med, $875,012 avg, 42d, 49.0% credits avg $15,307); attached: $522,950 med ($489,758 net).
- 3-Benchmark $/SqFt (Above-Grade / Finished / Total): Highlands Ranch detached: $349 / $286 / $244 (attached: $333 / $326 / $302). Sterling Ranch 80125 detached: $350 / $282 / $226.
- Tax & HRCA Schedule: Highlands Ranch ~84.7 mills (~0.64%, ~$4,622/yr) + $174/qtr HRCA in 2026 ($178.90/qtr Jan 1, 2027). Sterling Ranch CAB ~95–118+ mills (1.02%–1.26%, $8,547–$12,147/yr) + Nov 2026 Ballot Issue 7A 0.333% FRPRD retail sales tax.
Data footer: Based on information from REcolorado®, Inc. and Douglas County Assessor public property records for the stated period; not all sales are listed and information is deemed reliable but not guaranteed.
Property Tax Mill Levies, Dual-Meter Water & The 0.333% Rail Sales-Tax Split
Sterling Ranch finances roads and pools via CAB bonds that run ~$3,500–$6,500/yr above retired-bond Highlands Ranch homes. As detailed in our Highlands Ranch property taxes guide, CAB levies plus dual-meter water add ~$325–$625/month, while 80125 also pays Ballot Issue 7A’s 0.333% rail sales tax that excludes most unincorporated Highlands Ranch homes.
Soils, Foothill Wind Exposure, Lot Setbacks & Unfinished Basements
When we tour homes together, I am never replacing your licensed home or structural inspector—my role as a residential builder, home rehab expert, and engineer is sharing general construction perspective so you know smart questions to ask. Most Sterling Ranch builder deliveries leave basements unfinished, requiring roughly $65,000 to $95,000+ to finish after closing compared to Highlands Ranch resales where basements are usually already complete.
- Dipping Bedrock & Expansive Soils: Near the Dakota Hogback uplift, dipping bedrock meets expansive bentonite clay. Ask your independent licensed structural inspector to verify floating basement slab void joints, sump discharge lines, and five-foot positive perimeter grading before any 11-month builder warranty expires.
- Wind Exposure & Tight Setbacks: On an open foothill bench near Waterton Canyon with five-to-six-foot side setbacks, Sterling Ranch decks benefit from wind-uplift hardware, composite or steel framing, and CAB open-rail fence review.
- Resale vs. Builder Incentives: As covered in our Douglas County new construction vs. resale guide, 80125 resellers compete directly against builder rate buydowns. Keep in mind that Colorado real estate fees are never set by law and remain individually negotiable outside the MLS, and REcolorado MLS rules prohibit displaying or offering broker compensation in any MLS field.
4 HRCA Rec Centers, DCSD Schools & Mineral vs. Titan Road Rail Hubs
Sterling Ranch sits minutes from Chatfield, Roxborough, and Waterton Canyon alongside Overlook Clubhouse, while 7th–12th graders bus into Highlands Ranch for Ranch View Middle and ThunderRidge High. Highlands Ranch includes four HRCA rec centers, 70+ trail miles, 8,200-acre Backcountry open space, and full Town Center shopping.
Builders in 80125 also pitch the planned ~2032 Colorado Connector (“CoCo”) rail stop near Santa Fe and Titan Road. As mapped in our RTD Light Rail, Mineral Station & C-470 commuter guide, CoCo’s ~2032 southern phase stops at Mineral Station too—giving western Highlands Ranch buyers active RTD D Line service today plus future CoCo rail while saving 12–20 minutes to the DTC.
Frequently Asked Questions
Why does Total Structure price per square foot look lower in Sterling Ranch than in Highlands Ranch?
Which Douglas County schools serve Sterling Ranch versus Highlands Ranch?

Highlands Ranch Realtor, residential builder, home rehab expert, and engineer who shares general construction knowledge, layout and remodeling ideas for basements, decks, landscaping, and kitchens, and helps clients know what questions to ask independent licensed inspectors.
Want a builder and engineer’s perspective when comparing Highlands Ranch vs. Sterling Ranch?
Read Saber’s Realtor, Builder & Engineer Bio or reach out directly for a personal advisory conversation.