


Highlands Ranch Market Insights
County Tax Value vs. Sale Price vs. Zestimate in Highlands Ranch

County Tax Value vs. Real Sale Price vs. Zestimate: What Your Highlands Ranch Home Is Really Worth
Every spring when tax postcards arrive in Highlands Ranch, neighbors ask if the County value matches real buyer prices. We compared over 1,300 recent local home sales directly against each home’s official County tax notice. Everyday single-family houses land within about $5,000 on average, yet townhomes, remodeled homes, and online Zestimates tell very different stories.
Does Your County Tax Notice Match Real Sale Prices?
When I sit across a kitchen island in Highlands Ranch, neighbors usually split into two camps over their property tax postcard. Half dismiss the County’s number as pure guesswork, while the other half treat it like an official bank appraisal.
To test both theories with real numbers, we matched over 1,300 recent Highlands Ranch home sales directly against each property’s official Douglas County tax notice. Think of your County value as a curb-level starting line rather than a walk-through price tag.
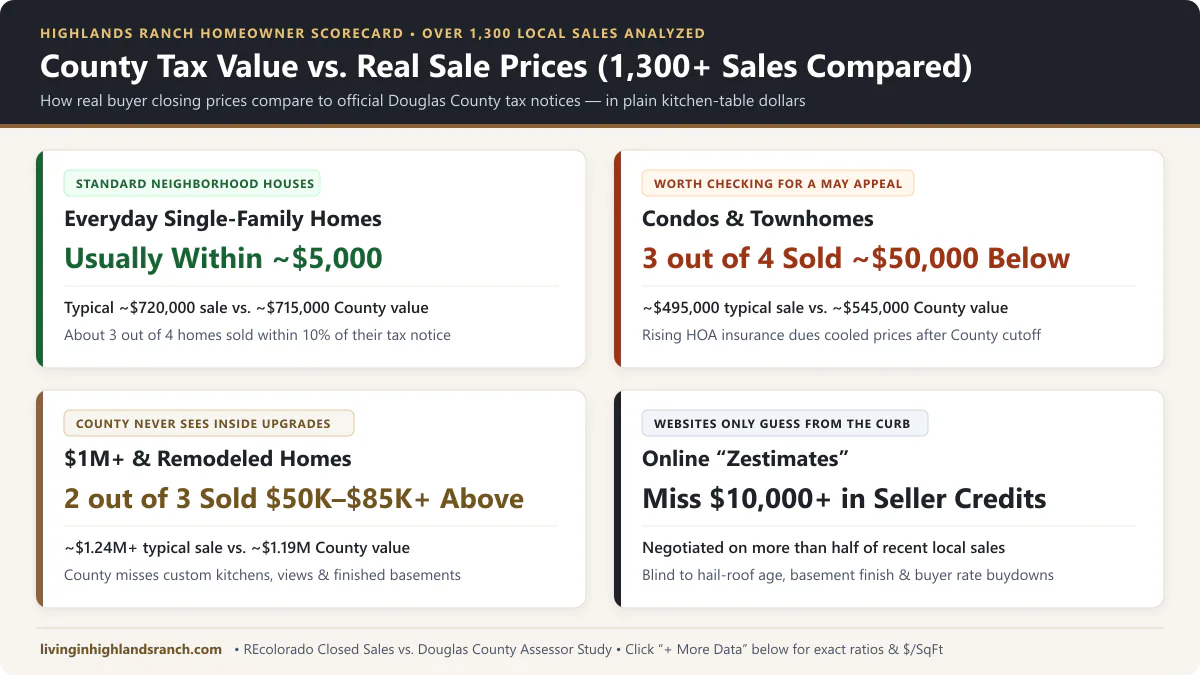
On a typical $720,000 single-family house, real buyers landed within about $5,000 of that County starting line. Once you look at attached townhomes or custom remodeled homes, however, real closing prices pull sharply away in opposite directions.
| Home Category | Typical County Value | Typical Real Sale Price | What It Means for You |
|---|---|---|---|
| Everyday Single-Family Homes | ~$715,000 | ~$720,000 (within ~$5,000) | About 3 out of 4 sold within 10% of County value, though roof age, layout, and lot backing still decide your true price. |
| Move-Up Family Homes ($700K–$999K) | ~$775,000 | ~$800,000 (~$25,000 higher) | Roughly 2 out of 3 beat their tax notice whenever owners updated kitchens, baths, decks, or basements. |
| $1M+ & Remodeled Homes | ~$1,190,000 | ~$1,240,000+ ($50K–$85K+ higher) | Roughly 2 out of 3 sold higher because the County computer has never stepped inside custom kitchens or walkout basements. |
| Condos & Townhomes | ~$545,000 | ~$495,000 (~$50,000 lower) | About 3 out of 4 sold below their tax notice after monthly HOA insurance dues rose, making May appeals worth checking. |
| Online “Zestimates” (Any Tier) | Curbside Website Guess | Misses $10,000+ Seller Credits | Websites refresh weekly, yet miss inside condition and $10,000+ buyer closing credits negotiated on over half of sales. |
+ More Data (See exact sales numbers, two-decimal ratios & 3-benchmark $/SqFt data)
| Market Segment / Build Era | Matched Sales | Median County / Sale Ratio | Spread & Direction | 3-Benchmark Closed $/SqFt (AG / Fin / Total) |
|---|---|---|---|---|
| All Core HRCA Resales | 1,304 sales | 99.23% Gross (100.17% Net) | 43.9% within ±5% · 75.5% within ±10% | $353 / $294 / $259 |
| Detached Single-Family (All Tiers) | 1,087 sales | 98.10% Gross ($719,964 vs. $737,500) | 77.5% within ±10% · 58.8% sold higher | $357 / $287 / $251 |
| Detached Under $750,000 | 564 sales | 100.04% Gross ($625,806 vs. $630,000) | 89.0% within ±10% · Balanced 50/50 split | $362 / $302 / $266 |
| Move-Up Homes ($700K – $999K) | 438 sales | 96.24% Gross ($773,858 vs. $800,000) | 41.3% within ±5% · 66.9% sold higher | $334 / $258 / $229 |
| $1M+ Luxury & Custom Remodels | 225 sales | 93.61% Gross ($1,187,968 vs. $1,237,500) | 68.0% sold higher (+$78,814 med individual gap) | $412 / $299 / $271 |
| Attached Condos & Townhomes | 217 sales | 105.69% Gross ($544,616 vs. $495,000) | Only 36.4% within ±5% · 74.7% sold lower | $331 / $320 / $305 |
| Build-Era Spread (1980s – 2010s+) | 156 – 592 / era | 1980s: 98.87% · 1990s: 97.83% · 2000s: 101.98% · 2010s+: 100.92% | 60.8% of 1990s homes sold higher; 80.8% of 2010s+ within ±10% | 1990s: $356/$285/$251 · 2010s+: $397/$346/$313 |
- Physical-Street-Address Deduplication & Standalone Province Center: Every REcolorado and dual-MLS IRES closing over the past 12 months (1,326 total matched sales) was deduplicated by exact physical street address, merging relist-reset cycles into 1 completed sale and isolating Province Center standalone (22 matched parcels; n = 21 completed resales at a 99.73% median County-to-sale ratio, with 1 partial-land build excluded).
- How to Read the County-to-Sale Ratio: Ratio equals Douglas County Actual Value divided by closed sale price (below 100% means the home sold above County value; above 100% means it sold below County value). Subtracting verified seller closing credits moves the community median from 99.23% Gross to 100.17% Net.
- Three-Benchmark Colorado $/SqFt Standard: Closed square-footage benchmarks separate $/Above-Grade SqFt (main + upper levels: $353), $/Finished SqFt (above-grade + finished basement: $294), and $/Total Structure SqFt (including unfinished basement expansion potential: $259).
Look Up Your Street Address: County Tax Value & Sweet-Spot Comparison
Type any Highlands Ranch street address to see your official County tax value, estimated yearly tax, and how your home tier performed across 1,300+ local sales.
Townhomes, Remodeled Homes & Online “Zestimates”
Condos and townhomes saw the widest gap because Douglas County only updates tax values every odd-numbered year. Across our local study, three out of four attached homes closed roughly $50,000 below their County tax notice after association insurance dues rose.
Meanwhile, two out of three luxury and remodeled homes in Backcountry, Northridge, and Eastridge sold $50,000 to $85,000+ above County value. When we walk through a home together, I never replace your licensed home or structural inspector.
Instead, my job is to help you spot layout, drainage, and basement finishing and remodeling details early so you know what to ask independent pros. Two identical floor plans on the same street routinely close $40,000 to $90,000 apart based on inside upkeep alone.
Many neighbors assume online Zestimates solve that blind spot because real estate websites update every week. Even so, computer algorithms miss $10,000+ in seller closing credits negotiated on over half of recent sales tracked on our Highlands Ranch market reports hub.
| What We Compare | County Tax Value | Online “Zestimates” | Walk-Through Valuation |
|---|---|---|---|
| What It Sees | Public square footage, lot size, build year, and older odd-year lookback sales. | Weekly neighborhood closing deeds, public tax files, and active list prices. | Your real kitchen, basement, roof, windows, deck, lot view, and live buyer demand. |
| What It Misses | ~$50,000 townhome HOA shifts and $50,000–$85,000+ custom interior upgrades. | Inside upkeep, hail-roof age, basement finish, and $10,000+ seller closing credits. | Nothing hidden online—weighs true net sale prices after seller concessions. |
| Best Used For | Checking your yearly tax bill and deciding whether to file a May protest. | Casual curiosity—never for setting an asking price or writing an offer. | Setting a confident list price, negotiating offers, and planning smart updates. |
+ More Data (See exact townhome vs. luxury ratios, Zestimate blind spots & seller-credit math)
- Attached Condos & Townhomes (n = 217 Sales · 105.69% Ratio): Exactly 74.7% of attached Highlands Ranch resales closed below their Douglas County Actual Value, with a median County tax value of $544,616 against a median closed sale price of $495,000 (only 36.4% landed within ±5%).
- $1M+ Luxury & Remodeled Homes (n = 225 Sales · 93.61% Ratio): Exactly 68.0% of $1M+ resales closed above their County Actual Value ($1,237,500 median sale vs. $1,187,968 County median, with a +$78,814 median individual sale-minus-County spread), while 66.9% of $700K–$999K move-up homes also closed higher at a 96.24% median ratio.
- Seller Closing Credits Hidden in Public Deeds (99.23% Gross vs. 100.17% Net): Public county deeds record gross contract prices without subtracting $10,000+ ($10,780 average credit when granted) in buyer mortgage-rate buydown and repair concessions negotiated on over 60% of Highlands Ranch sales, causing consumer Zestimate algorithms to overstate net seller proceeds.
- Same-Street Condition Swings ($40,000 – $90,000 Spread): Two identical floor plans on the same block routinely close $40,000 to $90,000 apart once buyers weigh Class 4 impact-resistant roofing, window seal integrity, furnace and AC age, composite decking, and open kitchen sightlines.
Property Taxes, May Protests & Smart Next Steps
If your remodeled home carries a County value $50,000 below real neighbor sales, enjoy the lower property tax bill quietly. Serious buyers and bank appraisers base offers on real walk-through comps rather than County tax postcards.
On a typical Highlands Ranch house, yearly property taxes run roughly $4,400 to $4,600 before exemptions. If your townhome or original-condition house looks overvalued, our Douglas County property tax protest guide shows how to pull the exact neighborhood sales the Assessor accepts in May.
Before you sell, downsize, or write an offer, skip the curb-level computer guesses altogether. Start with a custom Highlands Ranch home valuation grounded in a walk-through and true net closing prices.
+ More Data (See June 30 statutory cutoff dates, 6.8% assessment rate & 93.34 mill-levy math)
- Odd-Year Reappraisal & Mandatory June 30 Base-Date Cutoff: Colorado county assessors revalue residential properties in odd-numbered years (such as 2025 and 2027) using closed sales from the 18-to-24-month window ending June 30 of the prior even year (for example, the June 30, 2024 statutory cutoff governing the 2025–2026 tax cycle).
- Exact Property Tax Formula (~6.8% Assessment Rate & ~93.34 Mill Levy): Annual tax equals Actual Value (less any statutory valuation subtraction) multiplied by Colorado’s ~6.8% residential assessment rate to establish Assessed Value, then multiplied by the local ~93.34 mill levy ($93.34 per $1,000 of Assessed Value, or roughly $4,400–$4,600/yr on a $700,000 home before exemptions).
- May 1 Protest Window & Winning Appeal Evidence: Douglas County appeal windows open May 1 and close in early June; the strongest protests pair 3 to 5 similar neighborhood sales closed prior to the statutory June 30 base date with corrections to any overstated finished basement square footage on the Assessor’s property card.
- Standalone Province Center Note: In keeping with our strict neighborhood data isolation, Province Center was analyzed separately from Core HRCA subdivisions (22 matched parcels; n = 21 completed resales with a 99.73% median County-to-sale ratio).
Frequently Asked Questions
Why do most Highlands Ranch condos and townhomes sell below their County tax value?
What is the difference between “Actual Value” and “Assessed Value” on my Douglas County tax notice?
Should I tell the County Assessor about my kitchen remodel if my tax value looks too low?

Highlands Ranch Realtor, residential builder, home rehab expert, and engineer sharing construction knowledge, basement, deck, landscaping, and kitchen layout ideas, and questions to ask independent licensed inspectors.
Want a builder and engineer’s perspective on what your Highlands Ranch home would really sell for today?
Read Saber’s Realtor, Builder & Engineer Bio or reach out directly for a custom walk-through valuation.