


Highlands Ranch Market Insights
1980s vs. 1990s vs. 2000s+ Homes in Highlands Ranch

1980s vs. 1990s vs. 2000s+ Homes in Highlands Ranch: How Each Build Era Sells & Ages
When families tour Highlands Ranch with me, many assume a 2000s house automatically sells faster and brings fewer upkeep costs than a 1990s home. Looking across local sold-home and Douglas County property records, 1990s houses actually went under contract in 17 days compared to 42 days for 2000s builds. Below is how all four decades compare on layout, yard size, system lifespans, and negotiation leverage.
Why 1990s Homes Sold Faster Than 2000s Builds
When relocating buyers sit across my kitchen table, they almost always start by filtering online searches for homes built after 2000. On paper, a younger house with higher ceilings sounds like the safest bet in town.
Yet local sold-home and Douglas County property records tell a surprising story across Highlands Ranch. Nearly three in five detached houses here date to the 1990s, and they went under contract in 17 days.
Meanwhile, larger 2000s houses closed around $740,000, barely edging out updated 1990s neighbors. Even more telling, those 2000s listings sat on the market a median of 42 days before finding a buyer.
As a Residential Builder and Engineer, I see why every week on showings. Most 1990s homes already carry newer furnaces, windows, and hail-rated roofs, whereas original 2000s systems are hitting end-of-life right now.
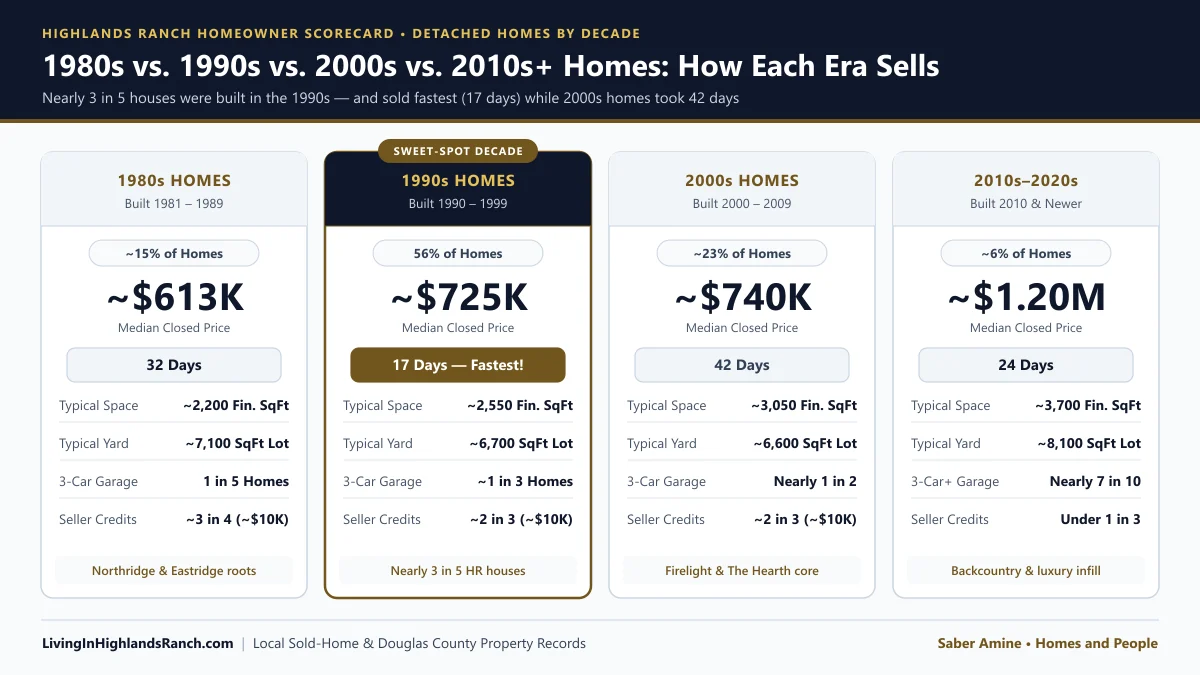
| Build Era & Share | Typical Space & Yard | Median Sale & Speed | What It Means for You |
|---|---|---|---|
| 1980s (1981–1989) ~15% of homes (1 in 7) |
~2,200 fin. sq ft on ~7,100 sq ft yards; 1 in 5 have a 3-car garage. | ~$613,000 in ~32 days | Mature trees and wider yards in Northridge and Eastridge; ~3 in 4 sellers gave ~$10,000 in closing credits. |
| 1990s (1990–1999) 56% of homes (nearly 3 in 5) |
~2,550 fin. sq ft on ~6,700 sq ft yards; ~1 in 3 have a 3-car garage. | ~$725,000 in ~17 days (Fastest) | Community sweet spot where many roofs and furnaces are already updated; ~2 in 3 sellers gave ~$10,000 in credits. |
| 2000s (2000–2009) ~23% of homes (nearly 1 in 4) |
~3,050 fin. sq ft on ~6,600 sq ft yards; nearly 1 in 2 have a 3-car garage. | ~$740,000 in ~42 days | Open 9-ft main levels on tighter lots, but buyers pause over 20–25 year roofs and HVAC; ~2 in 3 gave ~$10,000 credits. |
| 2010s–2020s (2010+) ~6% of homes (1 in 17) |
~3,700 fin. sq ft on ~8,100 sq ft yards; nearly 7 in 10 have a 3-car+ garage. | ~$1.20M in ~24 days | Modern 10-ft ceilings and 22% ranch layouts led by Backcountry; half of buyers paid cash and under 1 in 3 got credits. |
+ More Data (See exact 27,919 parcel counts, closed sample sizes & 3-benchmark $/SqFt splits)
| Decade Cohort | County Parcels & Share | 90-Day Closed / Unique | 3-Benchmark $/SqFt (AG / Fin / Total) | CDOM, Close-to-Orig % & Concessions |
|---|---|---|---|---|
| All Core HR Detached | 27,919 (100.00%) · Med Yr 1997 | n = 248 sold / 341 unique (72.7%) | $349 / $286 / $244 | 27 med (51.1 avg) d · 96.19% · 64.9% ($10,000 med / $11,228 avg) |
| 1980s (1981–1989) | 4,157 (14.89%; 4,162 w/ 5 pre-1981) | n = 35 sold / 56 unique (62.5%) | $368 / $299 / $262 ($612,500 med) | 32 med (43.5 avg) d · 95.71% · 77.1% ($10,000 med / $12,885 avg) |
| 1990s (1990–1999) | 15,691 (56.20%) · Med Lot 6,708 sf | n = 131 sold / 169 unique (77.5%) | $349 / $283 / $247 ($725,000 med) | 17 med (49.4 avg) d · 96.34% · 68.7% ($9,933 med / $10,561 avg) |
| 2000s (2000–2009) | 6,412 (22.97%) · Med Lot 6,576 sf | n = 56 sold / 82 unique (68.3%) | $334 / $274 / $229 ($739,500 med) | 42 med (66.3 avg) d · 95.63% · 64.3% ($10,000 med / $11,518 avg) |
| 2010s–2020s (2010+) | 1,654 (5.92%) · Med Lot 8,102 sf | n = 26 sold / 34 unique (76.5%) | $400 / $315 / $288 ($1,202,500 med) | 24 med (36.8 avg) d · 97.32% · 30.8% ($11,000 med; 50.0% cash) |
- Recorded Square-Footage & Style Progression: Median above-grade / finished / total structure square footage across Douglas County Assessor cards climbs from 1,768 / 2,174 / 2,607 sq ft in the 1980s (36.7% tri-level/split-level, 19.9% 3-car+ garage, 7,100 sq ft median lot) to 2,117 / 2,546 / 3,078 sq ft in the 1990s (82.8% 2-story, 36.2% 3-car+ garage), 2,542 / 3,047 / 3,814 sq ft in the 2000s (90.4% 2-story, 48.3% 3-car+ garage), and 2,563 / 3,688 / 4,377 sq ft in 2010+ builds (22.3% 1-story ranch, 69.1% 3-car+ garage, comprising 1,481 parcels built 2010–2019 and 173 built 2020–2026).
- Three-Era Neighborhood Scorecard Reconciliation: When grouped into our 3-era sitewide scorecard buckets, 1981–1999 Established SFRs recorded n = 166 closed sales ($702,500 median, 22 med days, $355 / $286 / $250 $/SqFt), 2000–2014 Executive SFRs recorded n = 62 closed sales ($720,000 median, 39 med days, $332 / $279 / $229 $/SqFt), and 2015+ Newer Luxury SFRs recorded n = 20 closed sales ($1,224,975 median, 26 med days, $478 / $320 / $304 $/SqFt).
- Standalone Province Center Isolation: Province Center (536 detached parcels, median build year 1998, 6,926 sq ft median lot) is isolated from Core HRCA macro totals; across the same 90-day window, Province Center logged n = 6 closed sales at a $668,091 median sale price, 16 median days, and $344 / $258 / $237 $/SqFt (with 4,224 attached Core HR condo/townhome parcels also tracked separately).
Data footer: Based on information from REcolorado®, Inc. and Douglas County Assessor public property records for the stated 90-day period (August 5, 2026 through November 2, 2026); not all sales are listed and information is deemed reliable but not guaranteed.
Look Up Any Street Address: Build Era, Recorded SqFt & Inspector Checklist
Type any Highlands Ranch street address to see its exact build year, floor-plan and lot dimensions, decade sale benchmark, and era-specific questions to ask an independent licensed home inspector.
What Changes Inside Each Highlands Ranch Build Decade
Highlands Ranch grew from north to south starting when Mission Viejo broke ground near County Line Road in 1981. Whenever we tour together, I share general construction context so you know which questions to ask independent licensed home and structural inspectors.
In the 1980s filings across Northridge and early Eastridge, homes took shape on generous ~7,100 square foot yards shaded by mature trees. Over one in three feature tri-level or split-level layouts paired with classic two-car garages.
Because gray polybutylene supply piping was installed nationwide through 1995, buyers touring 1980s and early-1990s homes should ask a licensed plumber to confirm copper or PEX updates. Scoping the underground sewer line to the street main is equally smart beneath mature roots.
During the 1990s boom under Shea Homes across Eastridge, Westridge, Northridge, and Southridge, builders delivered 56% of our detached housing stock. Traditional two-story plans averaging ~2,550 finished square feet became standard as mid-decade framing shifted to quieter engineered floor joists.
Many 1990s kitchens sit behind a partial family-room wall that owners love opening up for island seating. Review our builder guide to opening 1990s load-bearing kitchen walls with a licensed structural engineer, and have your home inspector check deck ledger bolts and 36-inch frost-line caissons.
In 2000s neighborhoods like Firelight and The Hearth, footprints expanded past ~3,050 finished square feet with airy ceilings and wider garage bays. Yards tightened to roughly 6,600 square feet, and buyers today look closely at whether original roofs, furnaces, and window seals were replaced.
Finally, post-2010 neighborhoods led by Backcountry make up roughly 6% of detached homes and sit in a ~$1.20M luxury tier. These modern builds bring tall ceilings, open-web floor trusses for clean zero-bulkhead basement ductwork, wider yards, and sought-after ranch layouts.
How to Price and Negotiate Across Build Eras
Build decade shapes closing-table leverage just as much as list price. Across recent closed sales, roughly two in three to three in four pre-2010 sellers credited around $10,000 toward buyer mortgage-rate buydowns or inspection items.
In the 2010-and-newer luxury tier, negotiation dynamics flip noticeably. Because half of buyers in that modern segment paid cash, fewer than one in three sellers offered closing credits at the table.
If you own a 2000s home in Firelight, The Hearth, or Southridge, avoiding that 42-day stall comes down to removing buyer guesswork upfront. Documenting your Class 4 roof certificate, HVAC service history, and window condition during a walk-through Highlands Ranch home valuation protects your equity against refreshed 1990s listings.
If you are comparing active Highlands Ranch homes for sale, pairing a clean 1990s layout or negotiating a smart rate-buydown credit on a 2000s build stretches your budget furthest. Colorado real estate fees are never set by law, remain individually negotiable outside the MLS, and REcolorado MLS prohibits displaying or offering broker compensation in any MLS field.
Frequently Asked Questions
Why did 1990s Highlands Ranch homes sell faster than 2000s homes in recent sales?
Which Highlands Ranch build eras can still have gray polybutylene water supply pipes?
How common are seller closing credits across older versus newer Highlands Ranch homes?

Highlands Ranch Realtor, residential builder, home rehab expert, and engineer who shares general construction knowledge, layout and remodeling ideas for basements, decks, landscaping, and kitchens, and helps clients know what questions to ask independent licensed inspectors.
Comparing 1980s, 1990s, 2000s, or newer homes in Highlands Ranch?
Read Saber’s Realtor, Builder & Engineer Bio or reach out directly for a personal advisory conversation.