


Highlands Ranch Market Insights
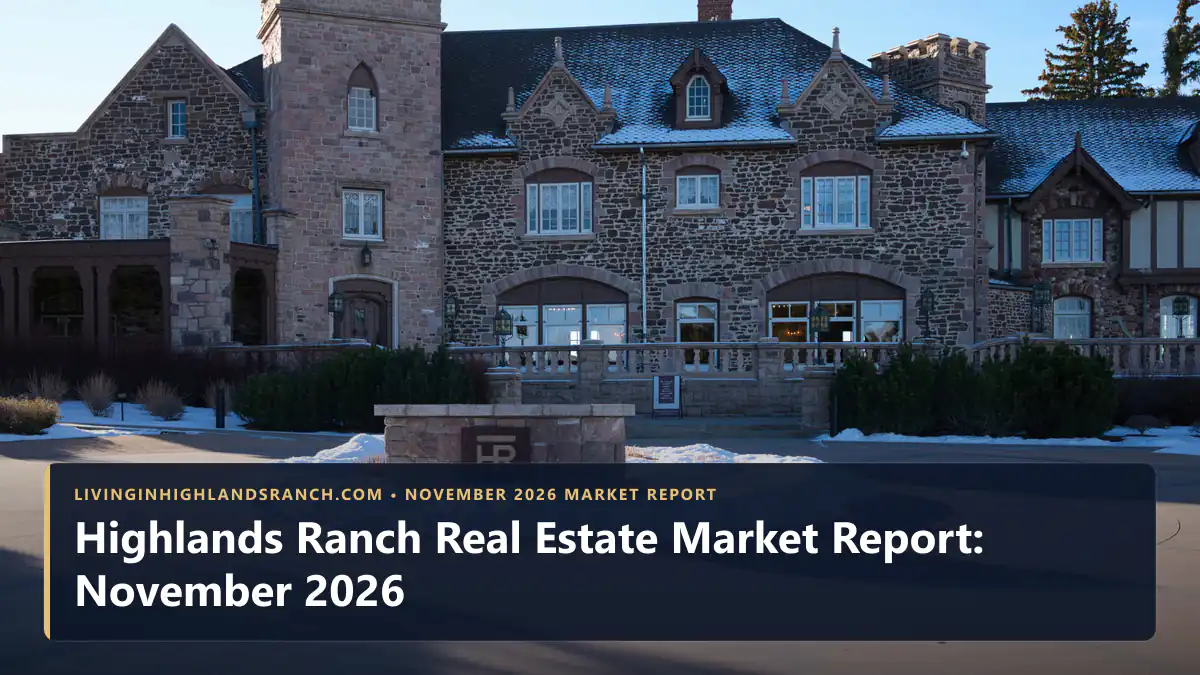
Highlands Ranch Real Estate Market Report: November 2026

Highlands Ranch Real Estate Market Report: November 2026
Read Video Transcript (0:58)
Comparing the last thirty days to our ninety-day baseline, single-family medians dipped from seven hundred fifteen thousand to six hundred seventy-seven thousand dollars, as days on market rose from twenty-seven to thirty-three. Over that same thirty-day window, condos and townhomes rose from four hundred eighty-two thousand five hundred to five hundred twenty-five thousand dollars in fifty-one days. Single-family price per square foot averaged three-forty-nine above grade, two-eighty-six finished, and two-forty-four total. Sixty-six percent of single-family sellers over the last thirty days paid concessions, averaging eleven thousand four hundred dollars. Week-one contracts netted eight thousand dollars above asking, while listings past forty-five days lost one hundred thousand dollars. Northridge hit seventy-nine percent seller concessions, while gated Backcountry sold in three median days. Historically, November buyers pay seventy-seven thousand five hundred dollars below April’s peak. Read my full November report at Living in Highlands Ranch dot com.
Entering November 2026, comparing the last 30 days to our 90-day baseline (where our sold data is updated every 30 days) shows detached single-family median prices in Highlands Ranch shifting from $715,000 over 90 days (248 sold, 27 median days on market, 72.7% sale success rate) to $677,000 over the last 30 days (71 sold, 33 median days). Over that same window, attached condos and townhomes rose from a $482,500 median over 90 days (50 sold in 58 median days) to $525,000 over the last 30 days (9 sold in 51 median days), while 64.9% of single-family sellers over 90 days (and 66.2% over the last 30 days) paid buyer concessions averaging $11,228 to $11,404 for mortgage rate buydowns and closing costs.
90-Day & 30-Day Highlands Ranch Market Scorecard
Evaluating the Highlands Ranch housing market entering November 2026 starts with separating detached single-family homes from attached condos and townhomes across both our 90-day baseline and the last 30 days (where our sold data is updated every 30 days). As an engineer and residential builder, I always separate Colorado valuation into three distinct benchmarks: above-grade square footage (main and upper levels), finished square footage (above-grade plus finished basement space), and total structure square footage (including unfinished basement footprint). Homes with well-designed finished basements commanded a $118,000 median resale premium over the last 90 days and a $92,000 median premium across the last six years, which you can explore in our basement finishing and remodeling guide.
| Market Segment | Sold & Success Rate | Median Sold & 3-Benchmark $/SqFt | Median Days & Concessions |
|---|---|---|---|
| Single-Family Detached (Last 90 Days) | 248 sold of 341 homes (72.7% sale success rate, #1 in South Metro; 85.2% over 12 months). | $715,000 median ($827,667 avg) · $349 above-grade · $286 finished · $244 total structure. | 27 median days · 64.9% paid concessions ($11,228 avg) · 96.19% close-to-original list · 19.8% cash. |
| Single-Family Detached (Last 30 Days) | 71 sold of 106 homes (67.0% sale success rate as seasonal autumn inventory adjusts). | $677,000 median ($771,281 avg) · $349 above-grade · $279 finished · $239 total structure. | 33 median days · 66.2% paid concessions ($11,404 avg) · 94.94% close-to-original list · 21.1% cash. |
| Condos & Townhomes (Last 90 Days) | 50 sold of 94 homes (53.2% sale success rate; 46.8% withdrew or expired unsold). | $482,500 median ($518,757 avg) · $333 above-grade · $326 finished · $302 total structure. | 58 median days · 50.0% paid concessions ($6,437 avg) · 93.55% close-to-original list · 48.0% cash. |
| Condos & Townhomes (Last 30 Days) | 9 sold of 30 homes (30.0% short-term sale success rate; strong buyer selectivity). | $525,000 median ($512,361 avg) · $319 above-grade · $293 finished · $277 total structure. | 51 median days · 22.2% paid concessions ($7,500 avg) · 95.65% close-to-original list · 55.6% cash. |
The 7-Day Pricing Cliff & Seller Concession Reality
The single biggest mistake a Highlands Ranch seller can make this autumn is pricing $25,000 to $40,000 above the market to test the waters. Across the 248 single-family homes that closed over the last 90 days, cumulative time on market drew a sharp boundary between sellers who protected their equity and sellers who absorbed six-figure combined reductions.
| Time on Market Tier | Closed Sales & Median Price | Close-to-Original List Ratio | Concessions & Net Seller Impact |
|---|---|---|---|
| 0 to 7 Days (Week 1 Sweet Spot) | 74 sold · $802,500 median ($378 above-grade / $308 finished / $268 total). | 101.71% of original list (+$13,986 average above initial asking price). | 68.9% paid credits ($8,697 avg) yet sellers still netted +$7,993 ahead of asking. |
| 8 to 21 Days (Weeks 2 to 3) | 35 sold · $700,000 median ($338 above-grade / $259 finished / $240 total). | 98.41% of original list (-$12,736 average price change from initial list). | 57.1% paid credits ($12,964 avg) · -$20,144 total combined net seller impact. |
| 22 to 45 Days (Month 2 Cliff) | 49 sold · $675,000 median ($341 above-grade / $295 finished / $249 total). | 96.57% of original list (-$24,915 average price drop from initial list). | 65.3% paid credits ($13,289 avg) · -$33,594 total combined net seller impact. |
| 46+ Days (Stale & Relisted Tier) | 90 sold · $715,000 median ($331 above-grade / $265 finished / $230 total). | 90.59% of original list (-$92,650 average price reduction; 89.86% at 61+ days). | 64.4% paid credits ($11,719 avg) · -$100,202 combined impact (-$109,179 at 61+ days). |
- For Sellers (Protecting Your Equity): Even though 68.9% of week-one sellers provided a closing credit averaging $8,697, their accurate Day-1 price generated 101.71% of asking and left them +$7,993 net ahead. Waiting for price cuts after Day 21 cost sellers $33,594 to $100,202.
- For Financed Buyers (Targeting Rate Buydowns): Over the last 90 days, 73.3% of Conventional buyers ($11,122 avg), 84.6% of VA buyers ($14,068 avg), and 90.0% of FHA buyers ($13,406 avg) negotiated seller concessions. Using an $11,228 credit for a 2-1 rate buydown lowers Year-1 monthly payments roughly five times more than an equivalent price cut.
- For All-Cash Buyers (Targeting Principal Reductions): Cash buyers represented 19.8% of single-family and 48.0% of condo/townhome sales over 90 days (55.6% in the last 30 days), targeting listings past 30 days for direct price reductions.
How All 4 Macro Quadrants & 3 Build Eras Performed
Negotiation leverage varies significantly between established 1980s and 1990s homes in Northridge and Eastridge, 2000s and 2010s executive homes in Firelight, The Hearth, and Tresana, and newer luxury estates in gated Backcountry.
| Neighborhood or Build Era | Closed Sales & Success Rate | Median Price & 3-Benchmark $/SqFt | Median Days, Concessions & Cash |
|---|---|---|---|
| Eastridge (Single-Family) | 53 sold of 68 homes (77.9% sale success rate). | $715,000 median · $332 above-grade · $279 finished · $237 total structure. | 22 median days · 60.4% concessions ($10,188 avg) · 20.8% cash buyers. |
| Westridge (Single-Family) | 66 sold of 87 homes (75.9% sale success rate). | $700,000 median · $364 above-grade · $286 finished · $254 total structure. | 24 median days · 68.2% concessions ($8,935 avg) · 10.6% cash buyers. |
| Southridge (Single-Family) | 91 sold of 128 homes (71.1% sale success rate). | $769,000 median · $348 above-grade · $294 finished · $243 total structure. | 28 median days · 59.3% concessions ($12,502 avg) · 28.6% cash buyers. |
| Northridge (Single-Family) | 38 sold of 58 homes (65.5% sale success rate). | $665,000 median · $354 above-grade · $292 finished · $244 total structure. | 32 median days · 78.9% concessions ($13,486 avg; 92.9% in last 30 days) · 13.2% cash. |
| Gated Backcountry Enclave | 13 sold of 19 homes (68.4% sale success rate). | $1,360,000 median ($1,850,269 avg) · $578 above-grade · $372 finished · $313 total. | 3 median days (1 day in last 30 days) · 23.1% concessions · 76.9% all-cash buyers. |
| 1981 to 1999 Established Era | 166 sold of 225 homes (73.8% sale success rate). | $702,500 median · $355 above-grade · $286 finished · $250 total structure. | 22 median days · 70.5% concessions ($11,097 avg) · 13.9% cash buyers. |
| 2000 to 2014 Executive Era | 62 sold of 91 homes (68.1% sale success rate; includes Firelight $741.5K & The Hearth $682.5K). | $720,000 median · $332 above-grade · $279 finished · $229 total structure. | 39 median days · 61.3% concessions ($11,248 avg) · 25.8% cash buyers. |
| 2015 to Present Newer Luxury Era | 20 sold of 25 homes (80.0% sale success rate). | $1,224,975 median · $478 above-grade · $320 finished · $304 total structure. | 26 median days · 30.0% concessions ($13,667 avg) · 50.0% cash buyers. |
From a builder and rehab perspective, the higher concession rate in 1981 to 1999 homes (70.5% community-wide and 78.9% in Northridge) reflects how buyers negotiate when touring homes with older roofs, decks, or windows and deciding what questions to ask independent licensed inspectors. Meanwhile, single-story ranch homes remained our scarcest layout, with 25 sales reaching a $915,000 median ($494 above-grade) in 6 median days and 72.0% paying cash.
6-Year Appreciation, November Seasonality & 7-Suburb Comparison
Across more than 8,000 Highlands Ranch sales from 2021 through 2026 year-to-date, single-family median values climbed 14.5% (+$94,475, from $651,025 to $745,500), led by Southridge (+15.8%, +$114,250), Eastridge (+13.6%, +$85,000), Northridge (+13.5%, +$84,500), and Westridge (+12.4%, +$77,750), nearly doubling Lone Tree’s 7.6% five-year gain. Historically across six Novembers of sales, November single-family buyers also paid a $670,000 median ($77,500 below April’s $747,500 spring peak). You can browse live Highlands Ranch homes for sale and compare our 90-day performance against neighboring South Metro cities below.
| South Metro Community | 90-Day Sale Success Rate | Median Price & 3-Benchmark $/SqFt | Median Days & Avg Seller Credit |
|---|---|---|---|
| Highlands Ranch (Core) | 72.7% sold (27.3% failed · #1 highest closing rate). | $715,000 median · $349 above-grade · $286 finished · $244 total. | 27 median days · 64.9% concessions ($11,228 avg credit). |
| Centennial & Acres Green | 71.7% sold (28.3% failed). | $662,500 median · $360 above-grade · $278 finished · $250 total. | 28 median days · 65.6% concessions ($12,164 avg credit). |
| Littleton, Ken Caryl & Sterling Ranch | 69.5% sold (30.5% failed; 9-10 days in 80120/80127 vs. 42 days in 80125). | $740,000 median · $377 above-grade · $300 finished · $260 total. | 24 median days · 54.3% concessions ($13,579 avg; $15,307 in 80125). |
| Lone Tree (80124) | 65.6% sold (34.4% failed). | $1,043,000 median · $376 above-grade · $298 finished · $250 total. | 18 median days · 52.5% concessions ($9,389 avg credit). |
| Parker (80134 & 80138) | 62.1% sold (37.9% failed). | $699,900 median · $317 above-grade · $260 finished · $212 total. | 40 median days · 67.1% concessions ($13,281 avg credit). |
| Castle Rock (80104 & 80109) | 59.9% sold (40.1% failed). | $655,000 median · $313 above-grade · $253 finished · $208 total. | 42 median days · 63.2% concessions ($13,163 avg credit). |
| Castle Pines (80108) | 52.9% sold (47.1% failed). | $950,000 median · $400 above-grade · $274 finished · $246 total. | 65 median days · 64.9% concessions ($17,676 avg credit). |
Frequently Asked Questions
What is the median home price in Highlands Ranch in November 2026?
How do the three price-per-square-foot benchmarks compare in Highlands Ranch?
How many Highlands Ranch sellers are paying buyer concessions right now?
How does the 7-day pricing cliff affect Highlands Ranch home sellers?
How much have Highlands Ranch home values appreciated over the last five years?
Is November a good month to buy or sell a home in Highlands Ranch?

Highlands Ranch Realtor, residential builder, home rehab expert, and engineer who shares general construction knowledge, layout and remodeling ideas for basements, decks, landscaping, and kitchens, and helps clients know what questions to ask independent licensed inspectors.
Want a builder, engineer, and negotiator’s perspective when buying or selling in Highlands Ranch?
Read Saber’s Builder & Engineer Bio or reach out directly for a personal advisory conversation.